
From paper to digital, without breaking the revenue.

At SPEOS, bpost group, I aligned business, IT and operations around a common platform. Six pilot clients out of six validated the direction.

12 internal interviews · 6 pilot clients · signed Concept Report · MVP moved into production

Read the essentials

The essentials in 40 seconds

SPEOS, bpost group · Industrial postal · 2024–2025

Turning a postal offer built channel by channel into a shared experience, then giving the teams the means to keep it evolving.

The problem

  • Belgian mail volumes decline by about 8% a year.
  • Five separate entry points, no common customer journey.
  • Business protected the paper revenue.
  • IT drove the Agile transformation.
  • The design function did not exist yet.

My role

  • CX, UX and service design consultant, for twelve months.
  • Align business, IT and operations.
  • Build the shared customer journey.
  • Define the platform and the roadmap.
  • Embed UX and service design practices.

The decisions

  • Unify the five entry points into one platform.
  • Prioritise onboarding and monitoring.
  • Test the concepts with pilot clients.
  • Turn the pain points into a product backlog.

The result

  • Six pilot clients out of six validated the direction.
  • Engie test: 4.03 out of 5.
  • 76-page Concept Report signed by the sponsor.
  • The validated scope moved into production.
  • The teams had a shared frame to carry on.
01

Listening before designing

The teams talked about their tools; the clients lived one journey.

  • 12 internal experts interviewed, from operations to IT.
  • 6 pilot clients met, across the three segments, including Luminus.
  • A benchmark of the digital players already taking the SMEs.
  • The AS IS analysed tool by tool, screen by screen.
  • Goal: understand how SPEOS delivers its service, and what each role expects from a single platform.
An offer built channel by channelFive entry points, several processes and little visibility for the client
One shared target experienceFrom import to distribution, with a vision shared across business, operations, product and IT
Field validation6 pilot clients out of 6 validate the new experience
The transformation consisted of making an offer historically distributed by channel readable as a single customer experience.
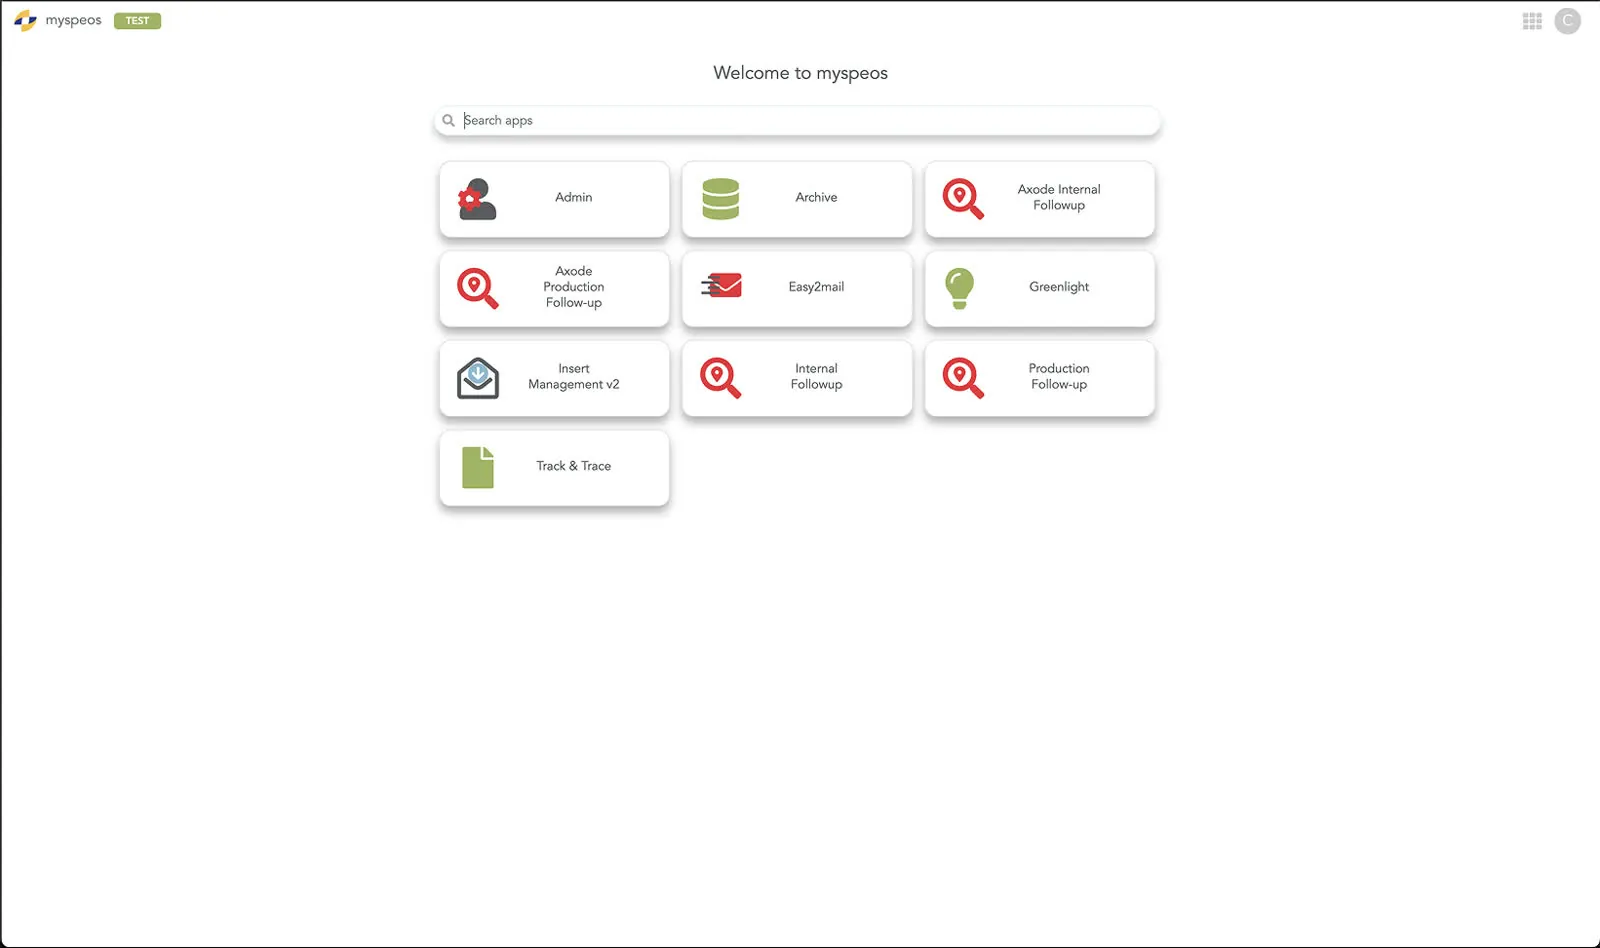
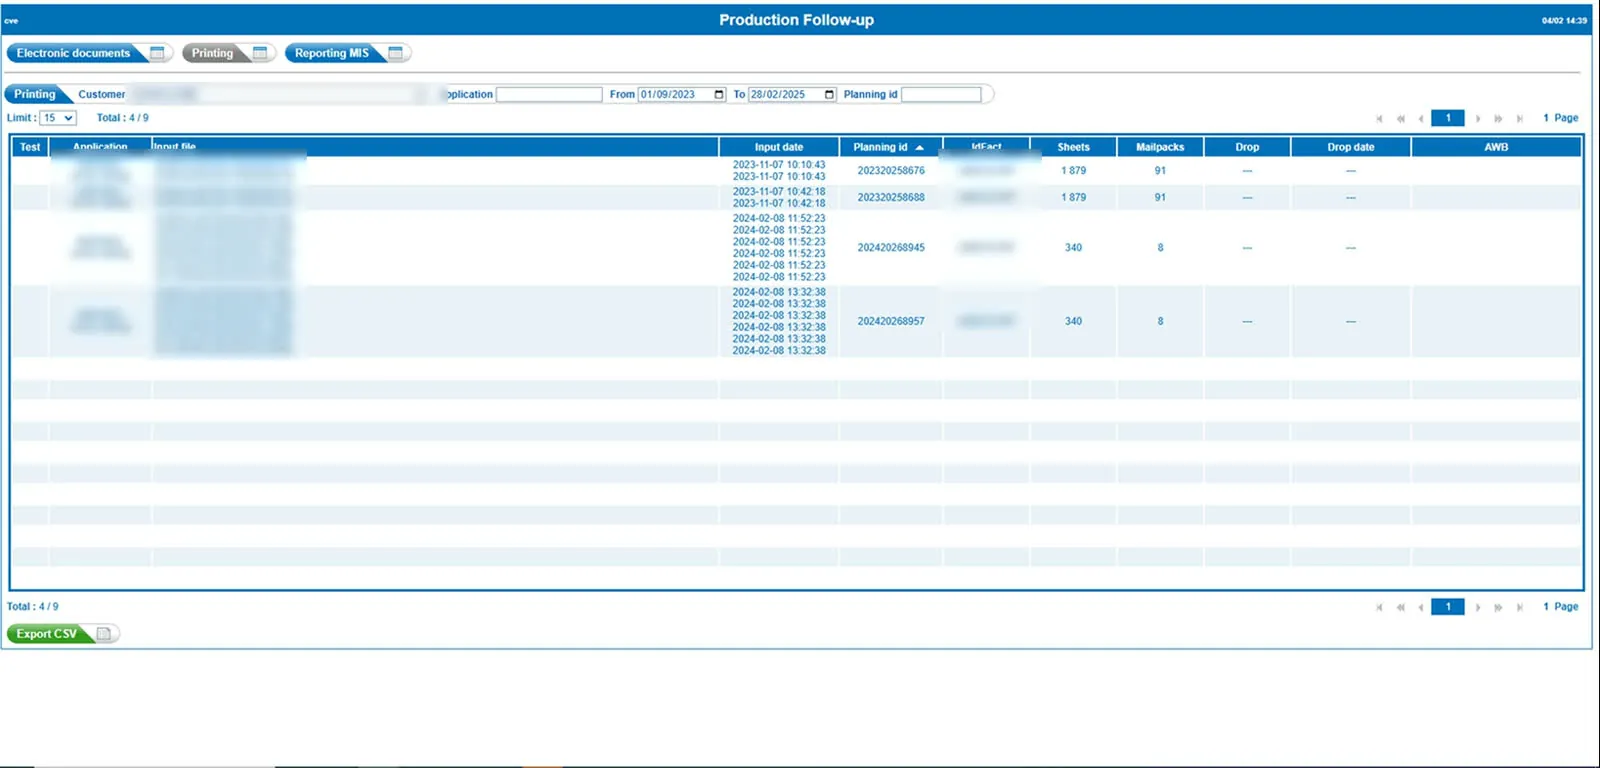
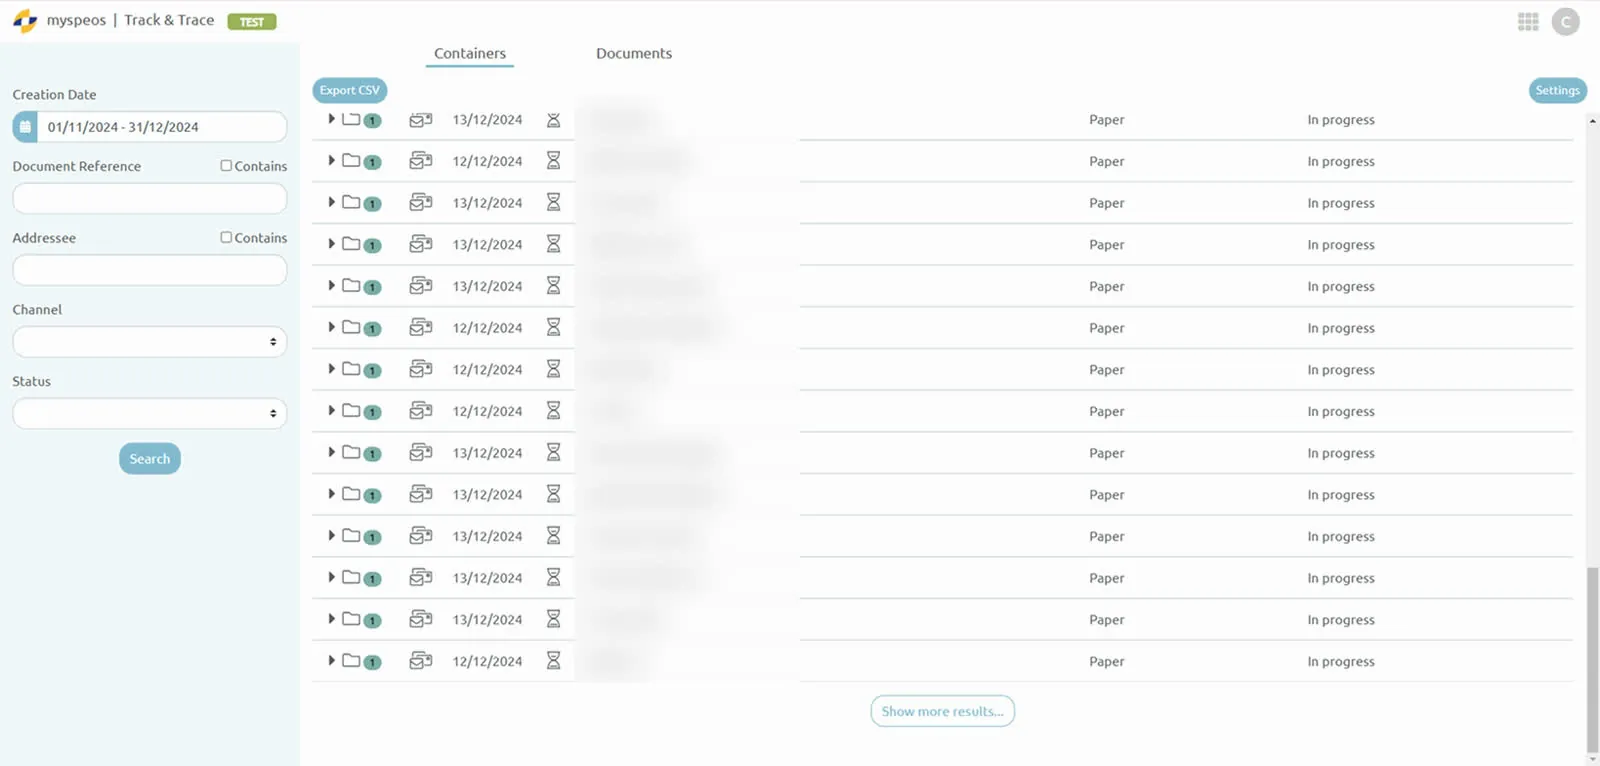
The existing situation at the time of the research, captured in a test environment, personal data and client references masked. These observations, crossed with the internal and external interviews, were then refined in the customer journey workshop. Move between screens with the arrows.
02

The research defined the MVP

The costliest pain points set the roadmap.

  • Onboarding depended on IT, with a time-to-market counted in months.
  • Errors surfaced too late, debugging was manual.
  • Little visibility on processing after sending.
  • Too many support requests for routine operations.
  • Priority: make onboarding and monitoring more autonomous.

Product decision

Prioritise onboarding and monitoring before advanced reporting.

01 · Cross-functional research

12 internal expertsIT, operations, finance, customer service, marketing, sales and production
6 pilot clientsThe three market segments, including Luminus
2 Engie usersResponsible for document flows, in a scored test

02 · Ten irritants, four families

AccelerateLong integrations, manual processes, time-to-market measured in months
EmpowerDependency on support, lack of self-service, batches impossible to correct partially
Make visibleBlack-box effect, hard-to-read statuses, lack of alerts and traceability
Make reliableErrors hard to diagnose, complex billing, proof requirements

03 · Four product answers

OnboardingReduce IT dependencies, speed up activation
MonitoringReal-time visibility on batches, files and errors
Reports & ArchivesProofs, logs and reports, centralised
BillingTraceable costs and statuses

04 · Field validation

4,03 / 5Combined score of the Engie test
9 / 10Average recommendation score
3 scenariosDashboard, error management, audit trail
2 usersA qualitative test, not a statistic
From interviews to tested concepts: ten irritants grouped into four value domains, then validated with users responsible for critical document flows.
"A good tool, for him, is a tool that is invisible when everything works, and clear when things go wrong."

Excerpt from the Nicolas Marchal persona, responsible for document flows, one of the two personas documented in depth to frame the design.

See the pain points in detail and how they translated into the product
IrritantConsequenceProduct answerValidation or insight
New client integration too slowIT dependency, time-to-market in weeks or monthsGuided onboarding: channels, connectors and workflows in self-serviceThe Concept Report's "IT-less onboarding" proposition explicitly targets reducing IT dependencies
No visibility after sendingDependency on an intermediary, manual checkingReal-time dashboard: statuses per batch, file and documentBest score of the Engie test: 4.0 and 4.8 out of 5 depending on the user
Generic error messages, batch blocked by a single fileManual debugging, dependency on supportCause identified, partial reprocessing, stop or restart file by fileThe test confirms the need: reprocess a document without resending the whole batch
Difficult traceability and auditLow reassurance for business, legal and compliance teamsAudit trail: timestamps, downloadable proofs, history and metadataReassurance at 1 out of 5 for one of the two users: sent back to design as a priority
Scattered reporting, complex billingErrors, operational costs, usage hard to controlReports, archives and billing in the same architectureThe value propositions target cost control, traceability and compliance
From irritants to product decisions: each row links an observed problem, its consequence, the designed answer and what the field said about it.
03

Five entry points replaced by one common platform

Clients no longer had to understand SPEOS's internal organisation to use its services. The proposition fit in one sentence, voiced by business and IT alike: one platform, from paper to digital without a break.

  • A single point of entry.
  • Shared navigation and interaction rules, set by the design system.
  • A continuous journey: import, define, distribute, monitor.
  • Business complexity remains, presented to the right role at the right moment.
01 Import The client brings in their data and documents, once.
02 Define They compose and configure their mailings, whatever the channel.
03 Distribute Paper or digital, from the same platform.
A one-stop platform, from creation to distribution. Recreated from the Concept Report artefact.
Before · one capability per toolConfiguration, production, tracking and archiving relied on separate applications and logics.
After · one continuous journeyThe same moments are connected in a single platform: configure, produce, track, understand and act.
From one tool per capability to a continuous journey: chapter 05 shows that journey, moment by moment.
04

The customer journey on the wall aligns the teams on 10 pain points

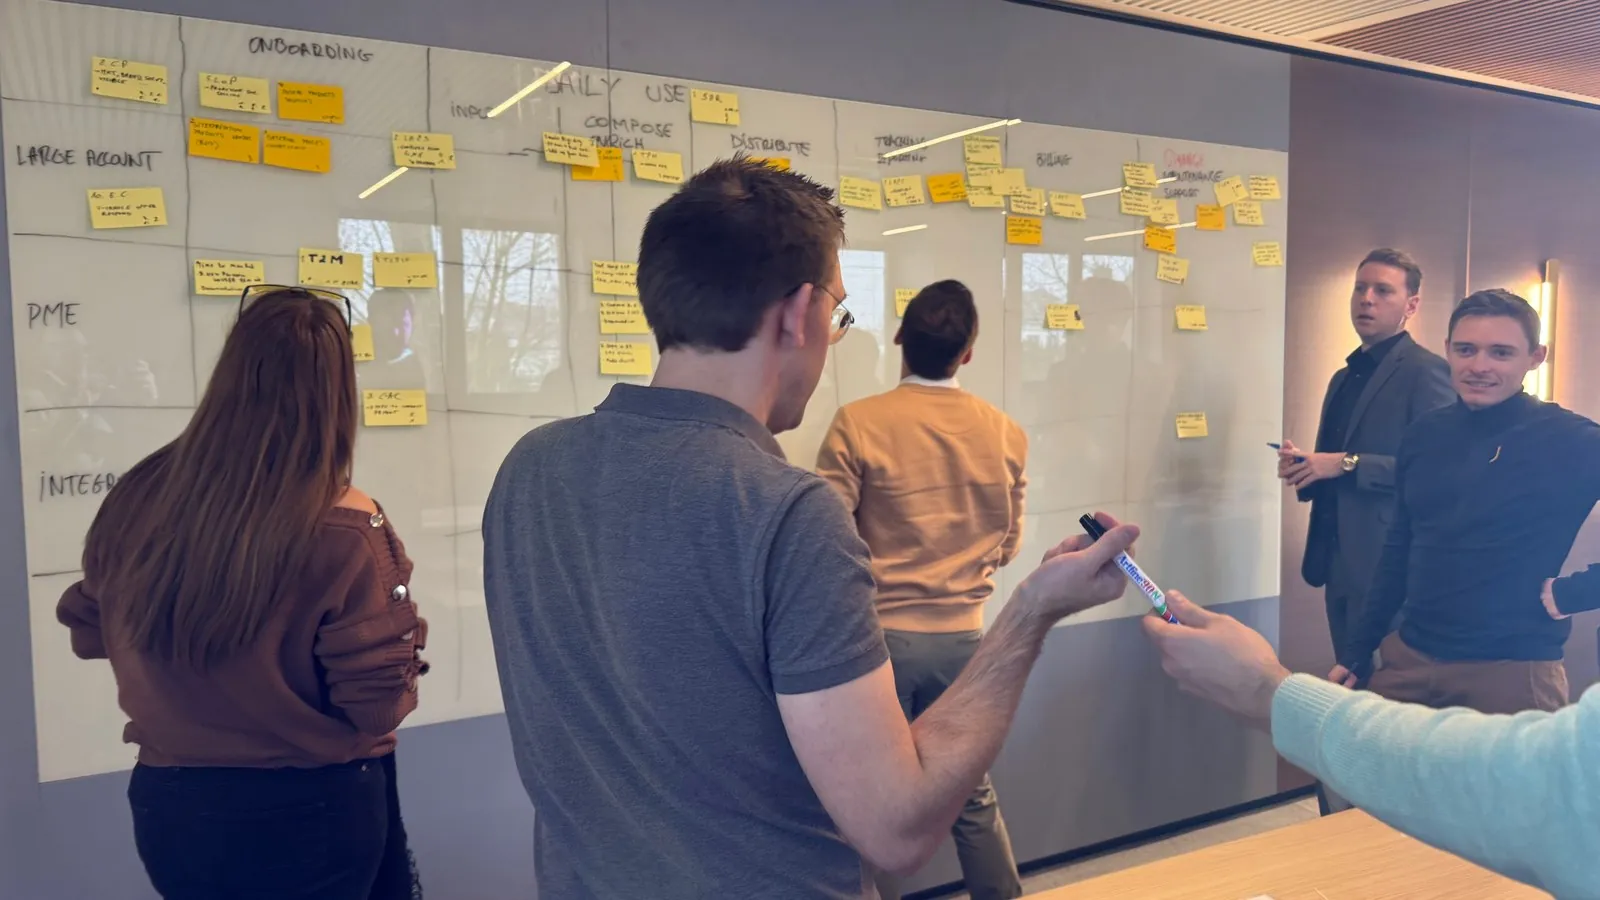
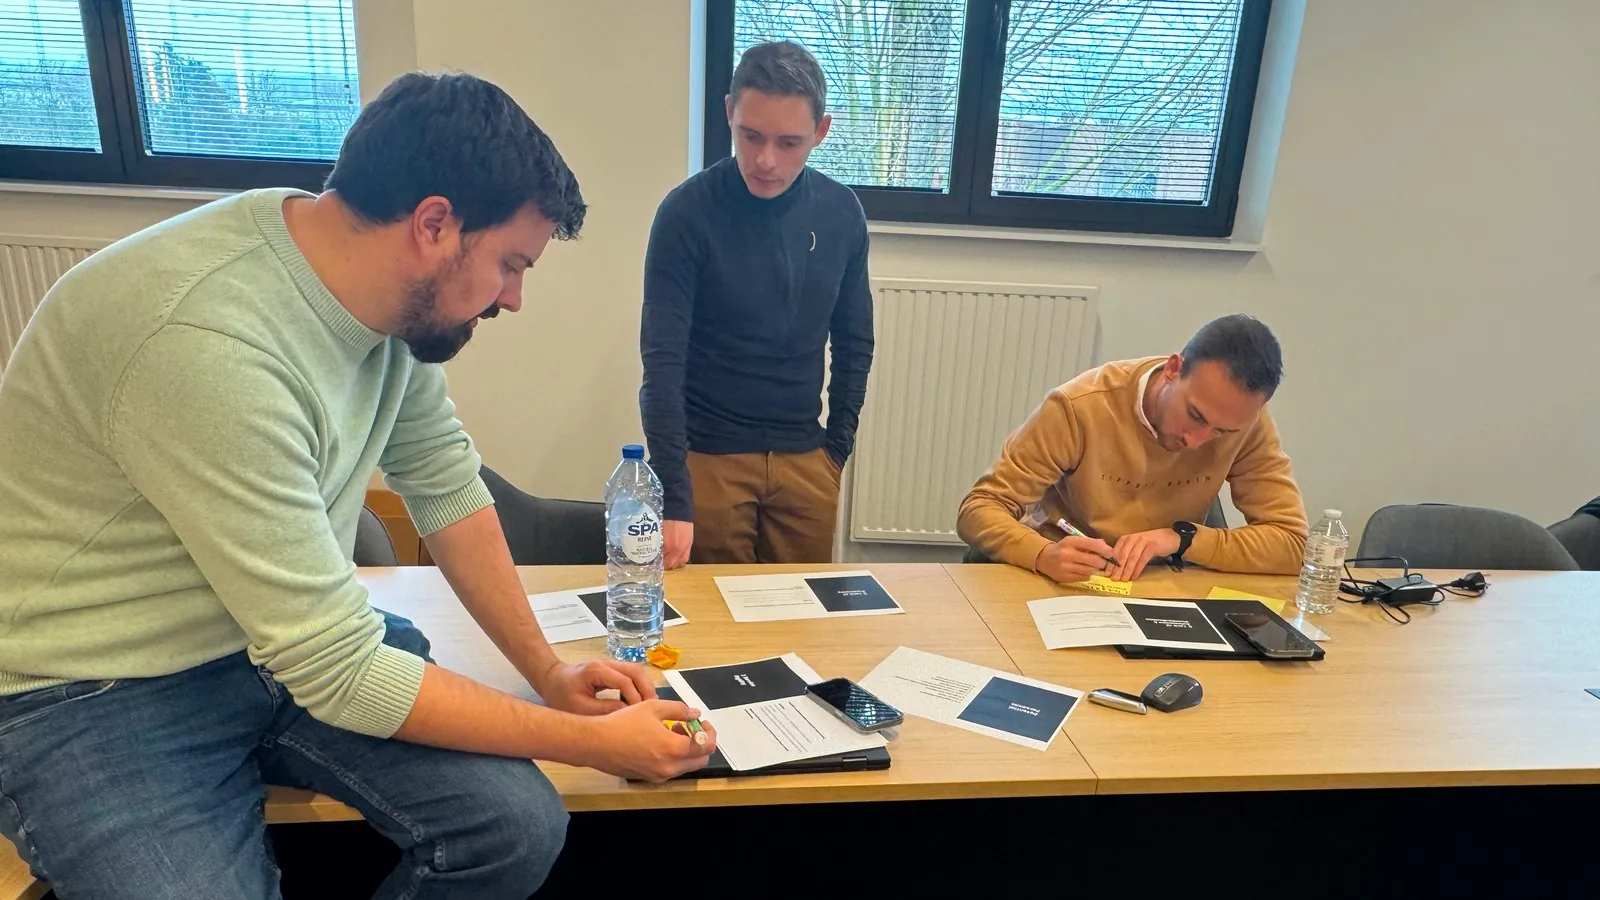
With the concept on the table, all departments rebuilt the journey together, on a wall rather than in a PowerPoint.

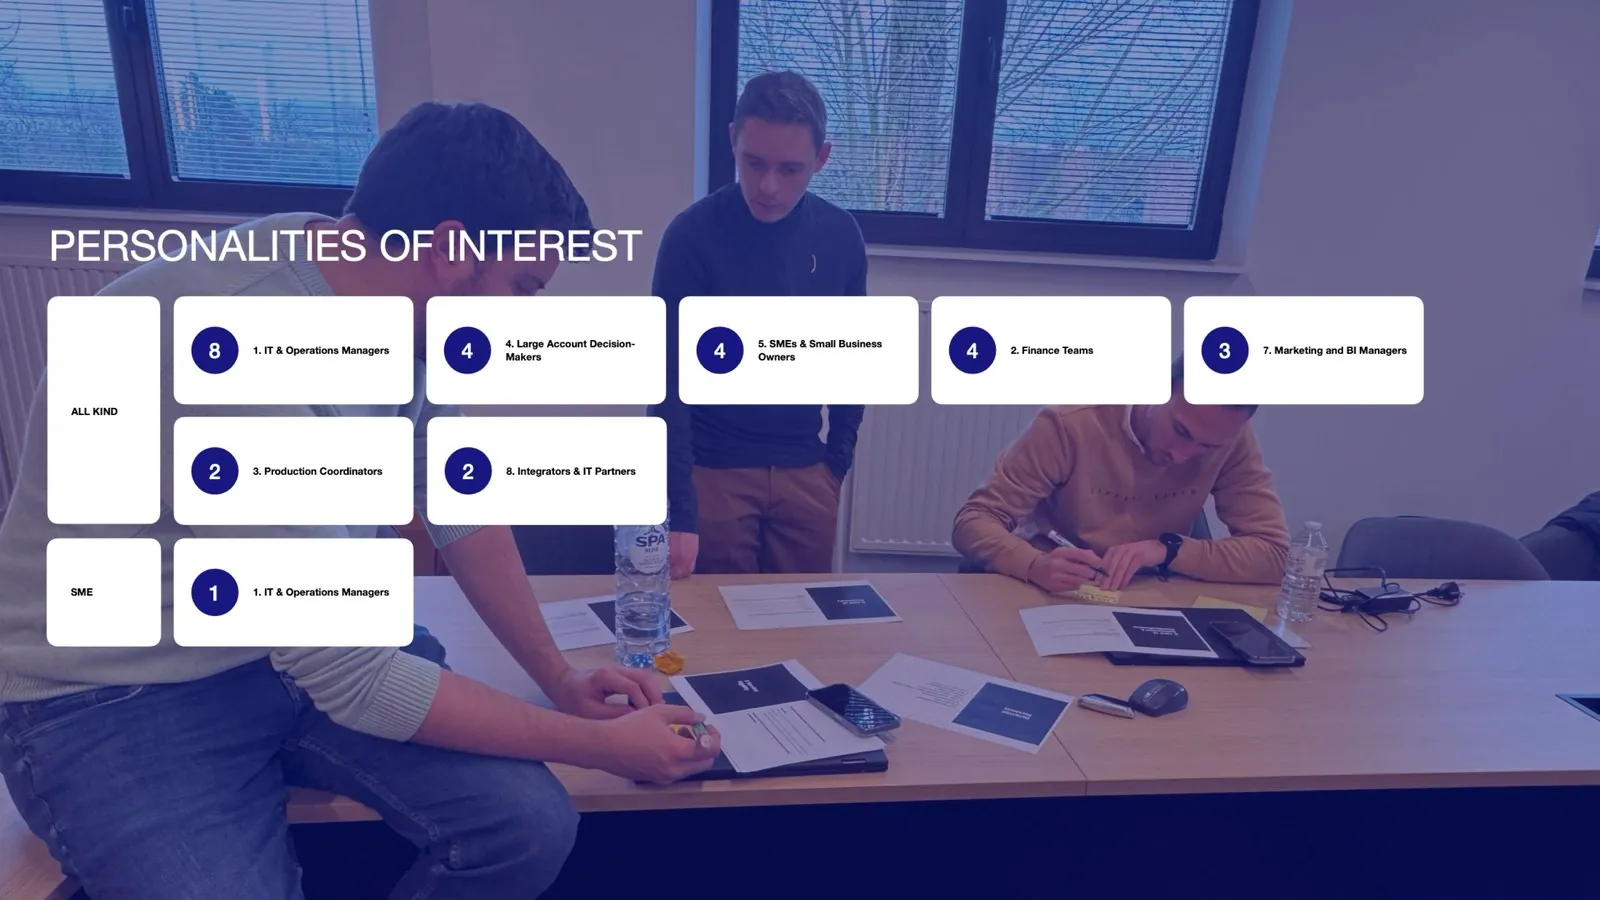
  • In the room: project managers, product owners, IT architects, business and operations.
  • Frictions are pinned where they block, in the words of those who live them.
  • 10 pain points placed on the journey, from onboarding delays to opaque billing.
  • Dot voting aligns the departments on priorities; onboarding comes out on top.
  • The digital transcription of the journey feeds the concept report.
The customer journey workshop, from the wall session to the decisions: this shared work is what aligned IT and Business on the same personas and the same priorities. Move between screens with the arrows.
The complete Customer Journey Map: Large Account, SME and Integrators rows, columns from onboarding to support, friction post-its on every phase.
The digital transcription of the complete journey, as it feeds the concept report: three segments, six phases from onboarding to support, ten pain points, and the red dots of the priority votes. The frame scrolls left to right; hover or touch to take control.
05

Two critical moments redesigned

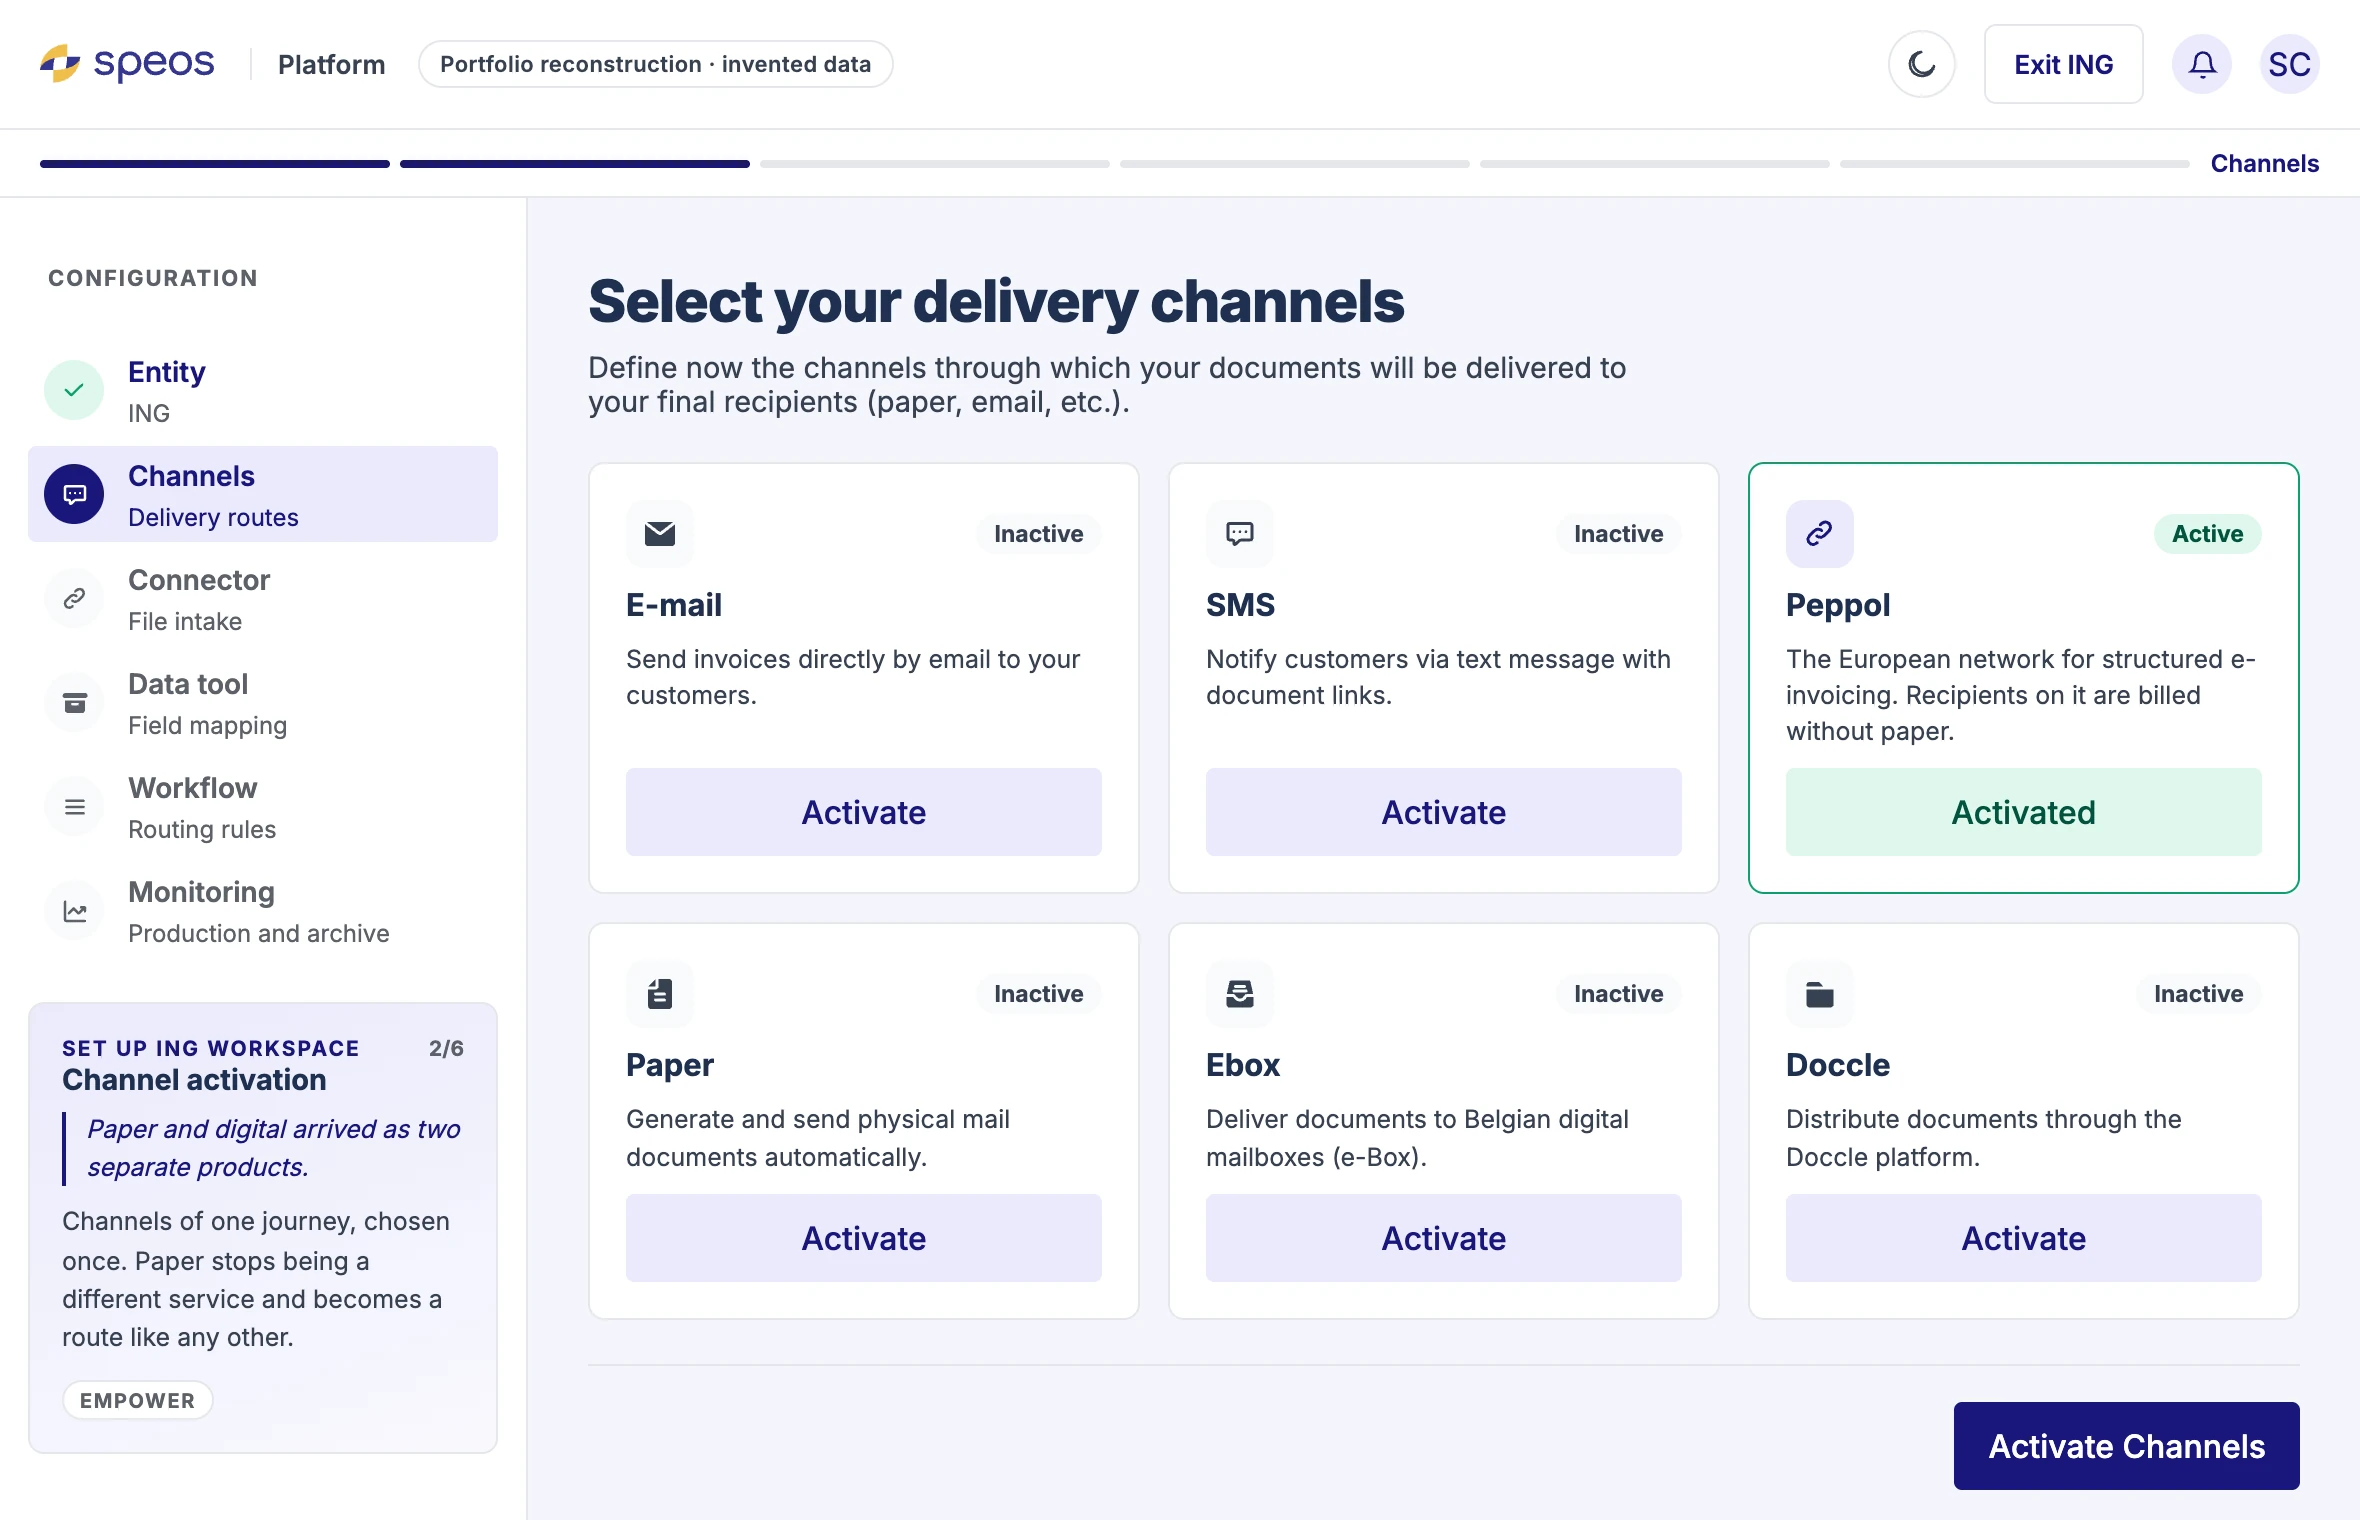
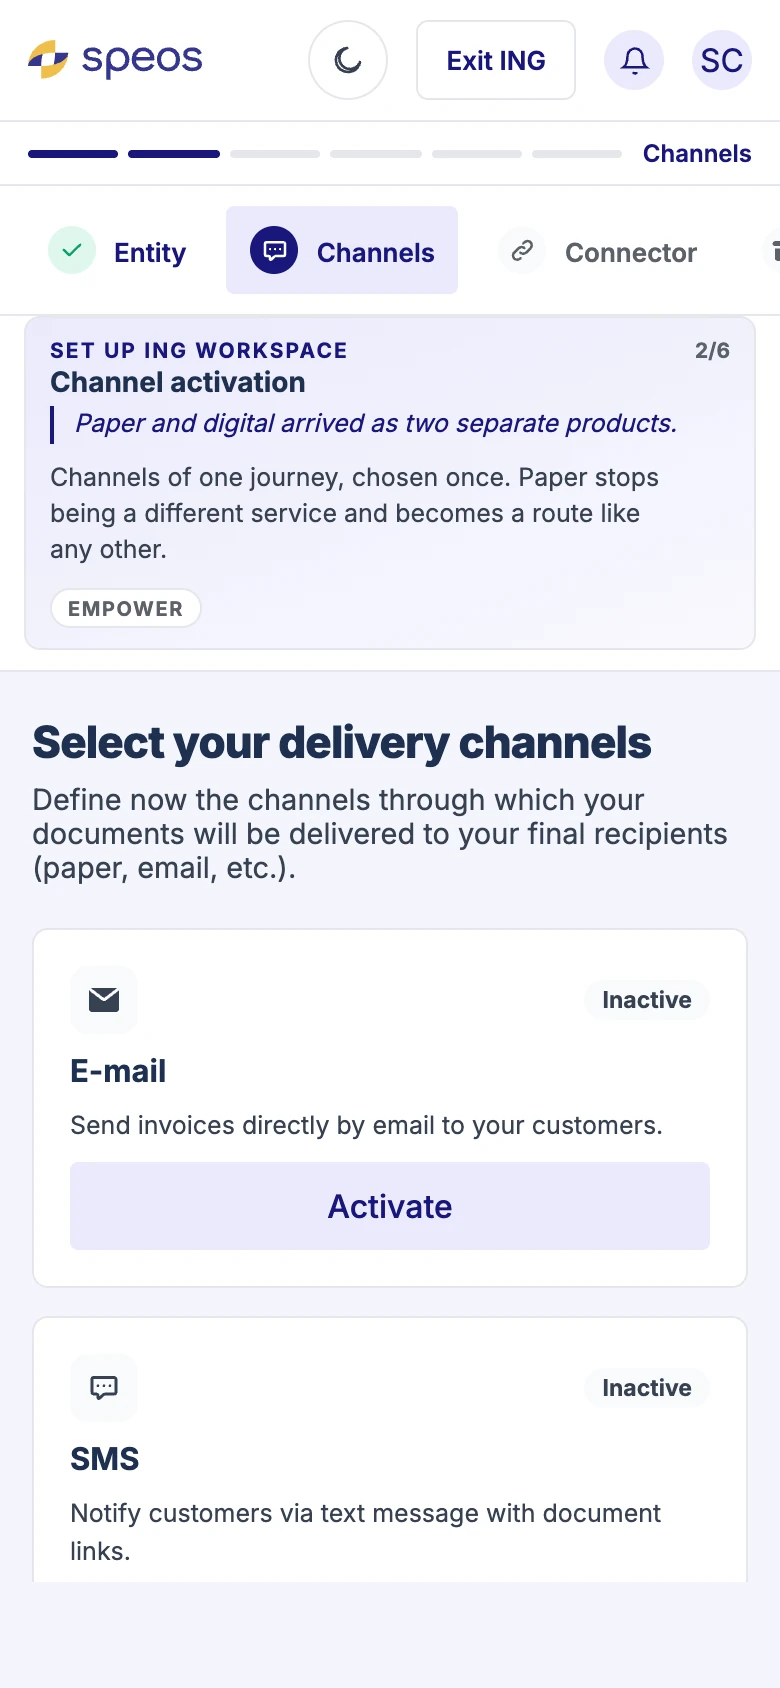
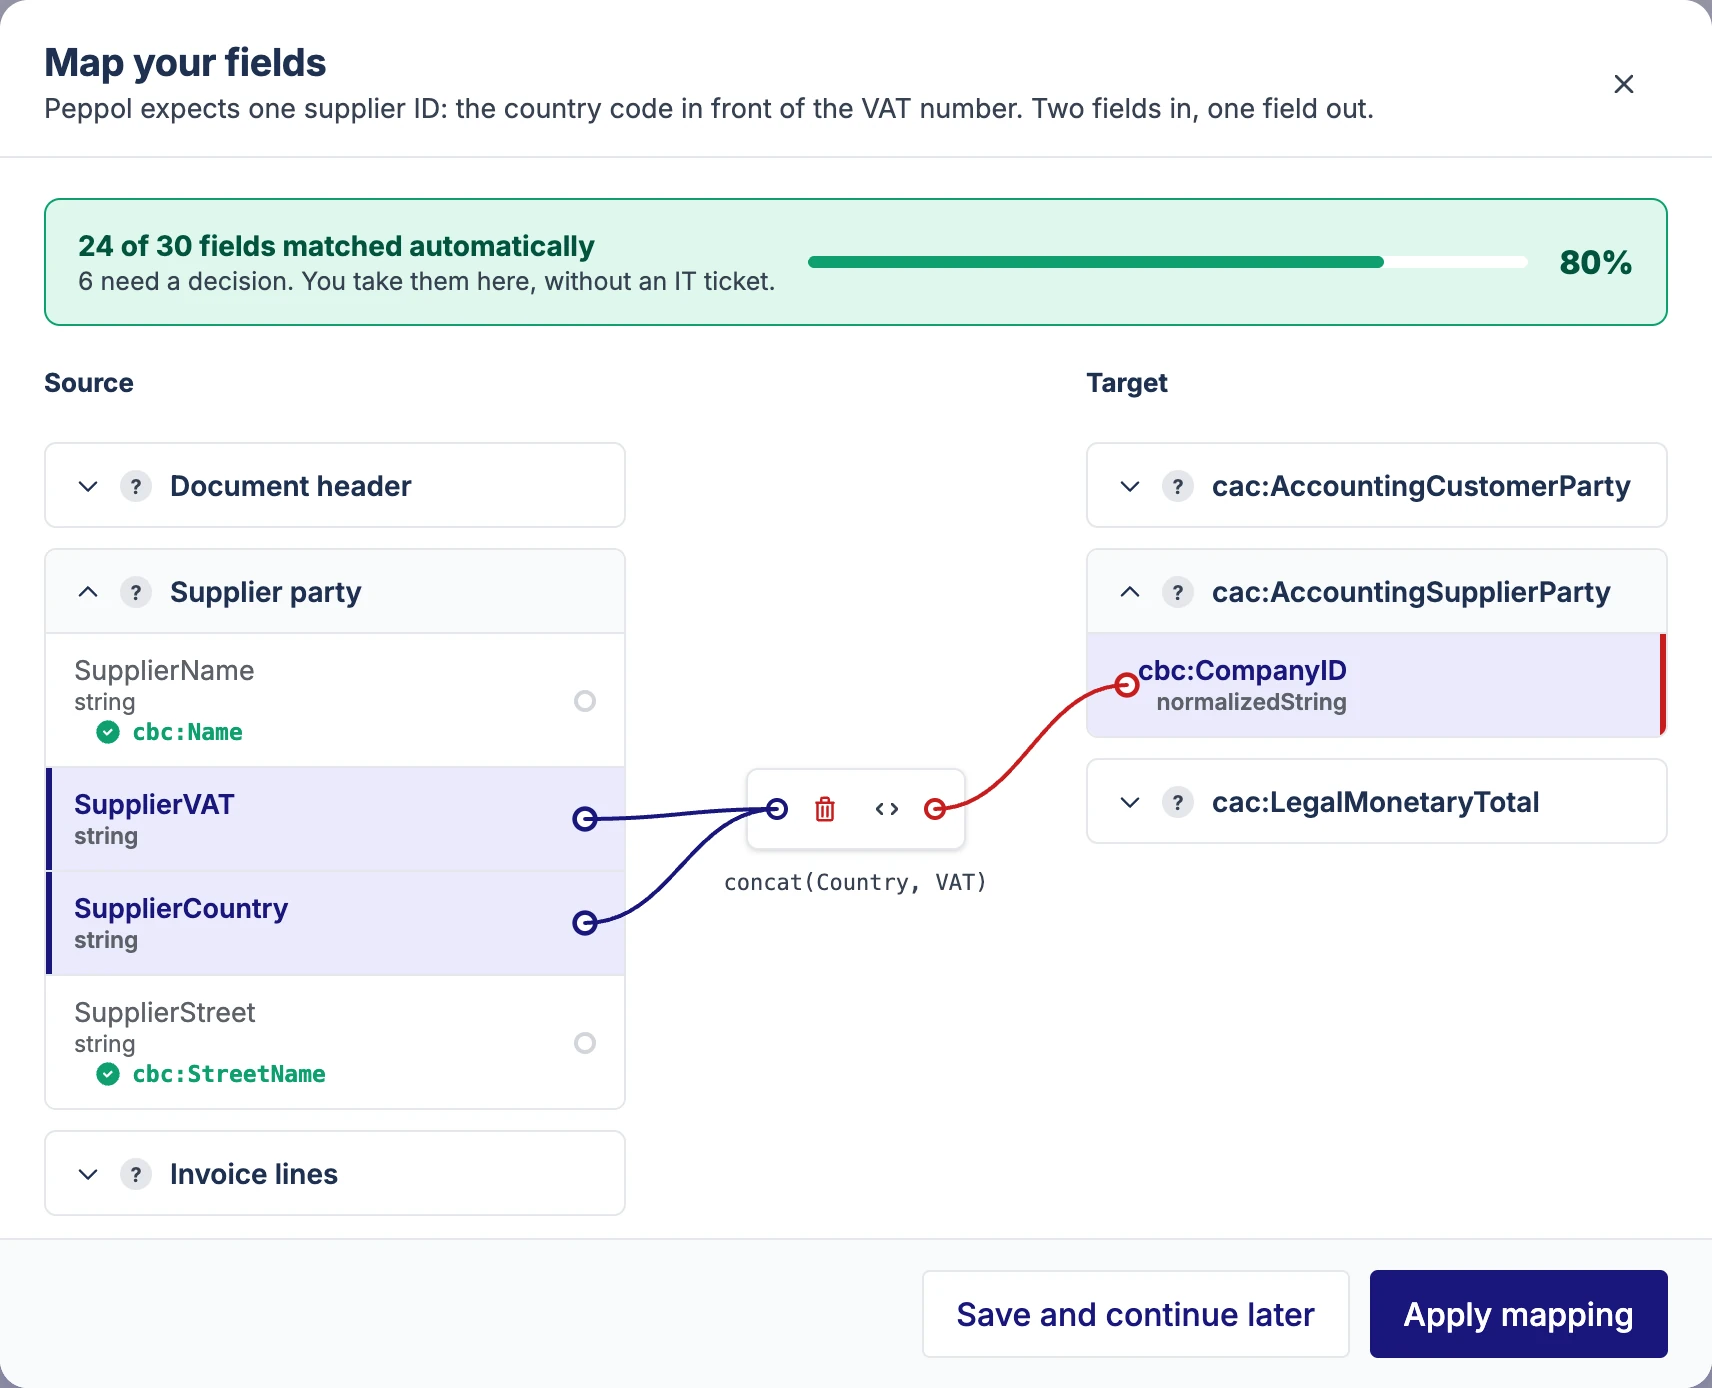
Onboarding: configure a service without depending on an IT project.

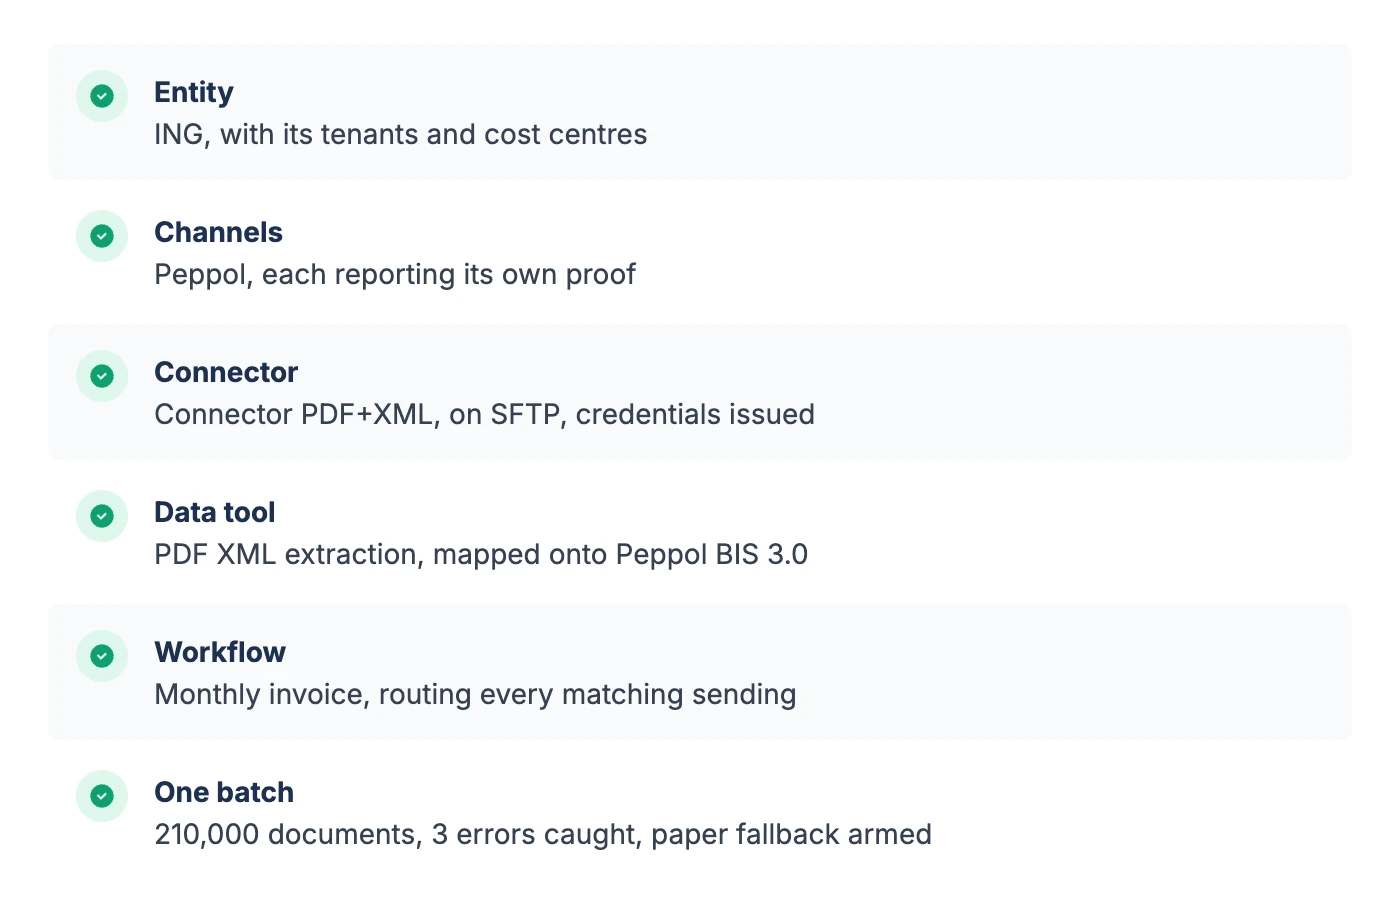
  • A guided journey in four steps, from channel activation to client invitation.
  • Connectors created without an IT ticket.
  • Field mapping with the mouse, no code.
  • Patterns reused for every new use case.
Prototype of the target vision, demo data: the same pattern of progress, configuration and confirmation guides every step.

AI demo Figma demo

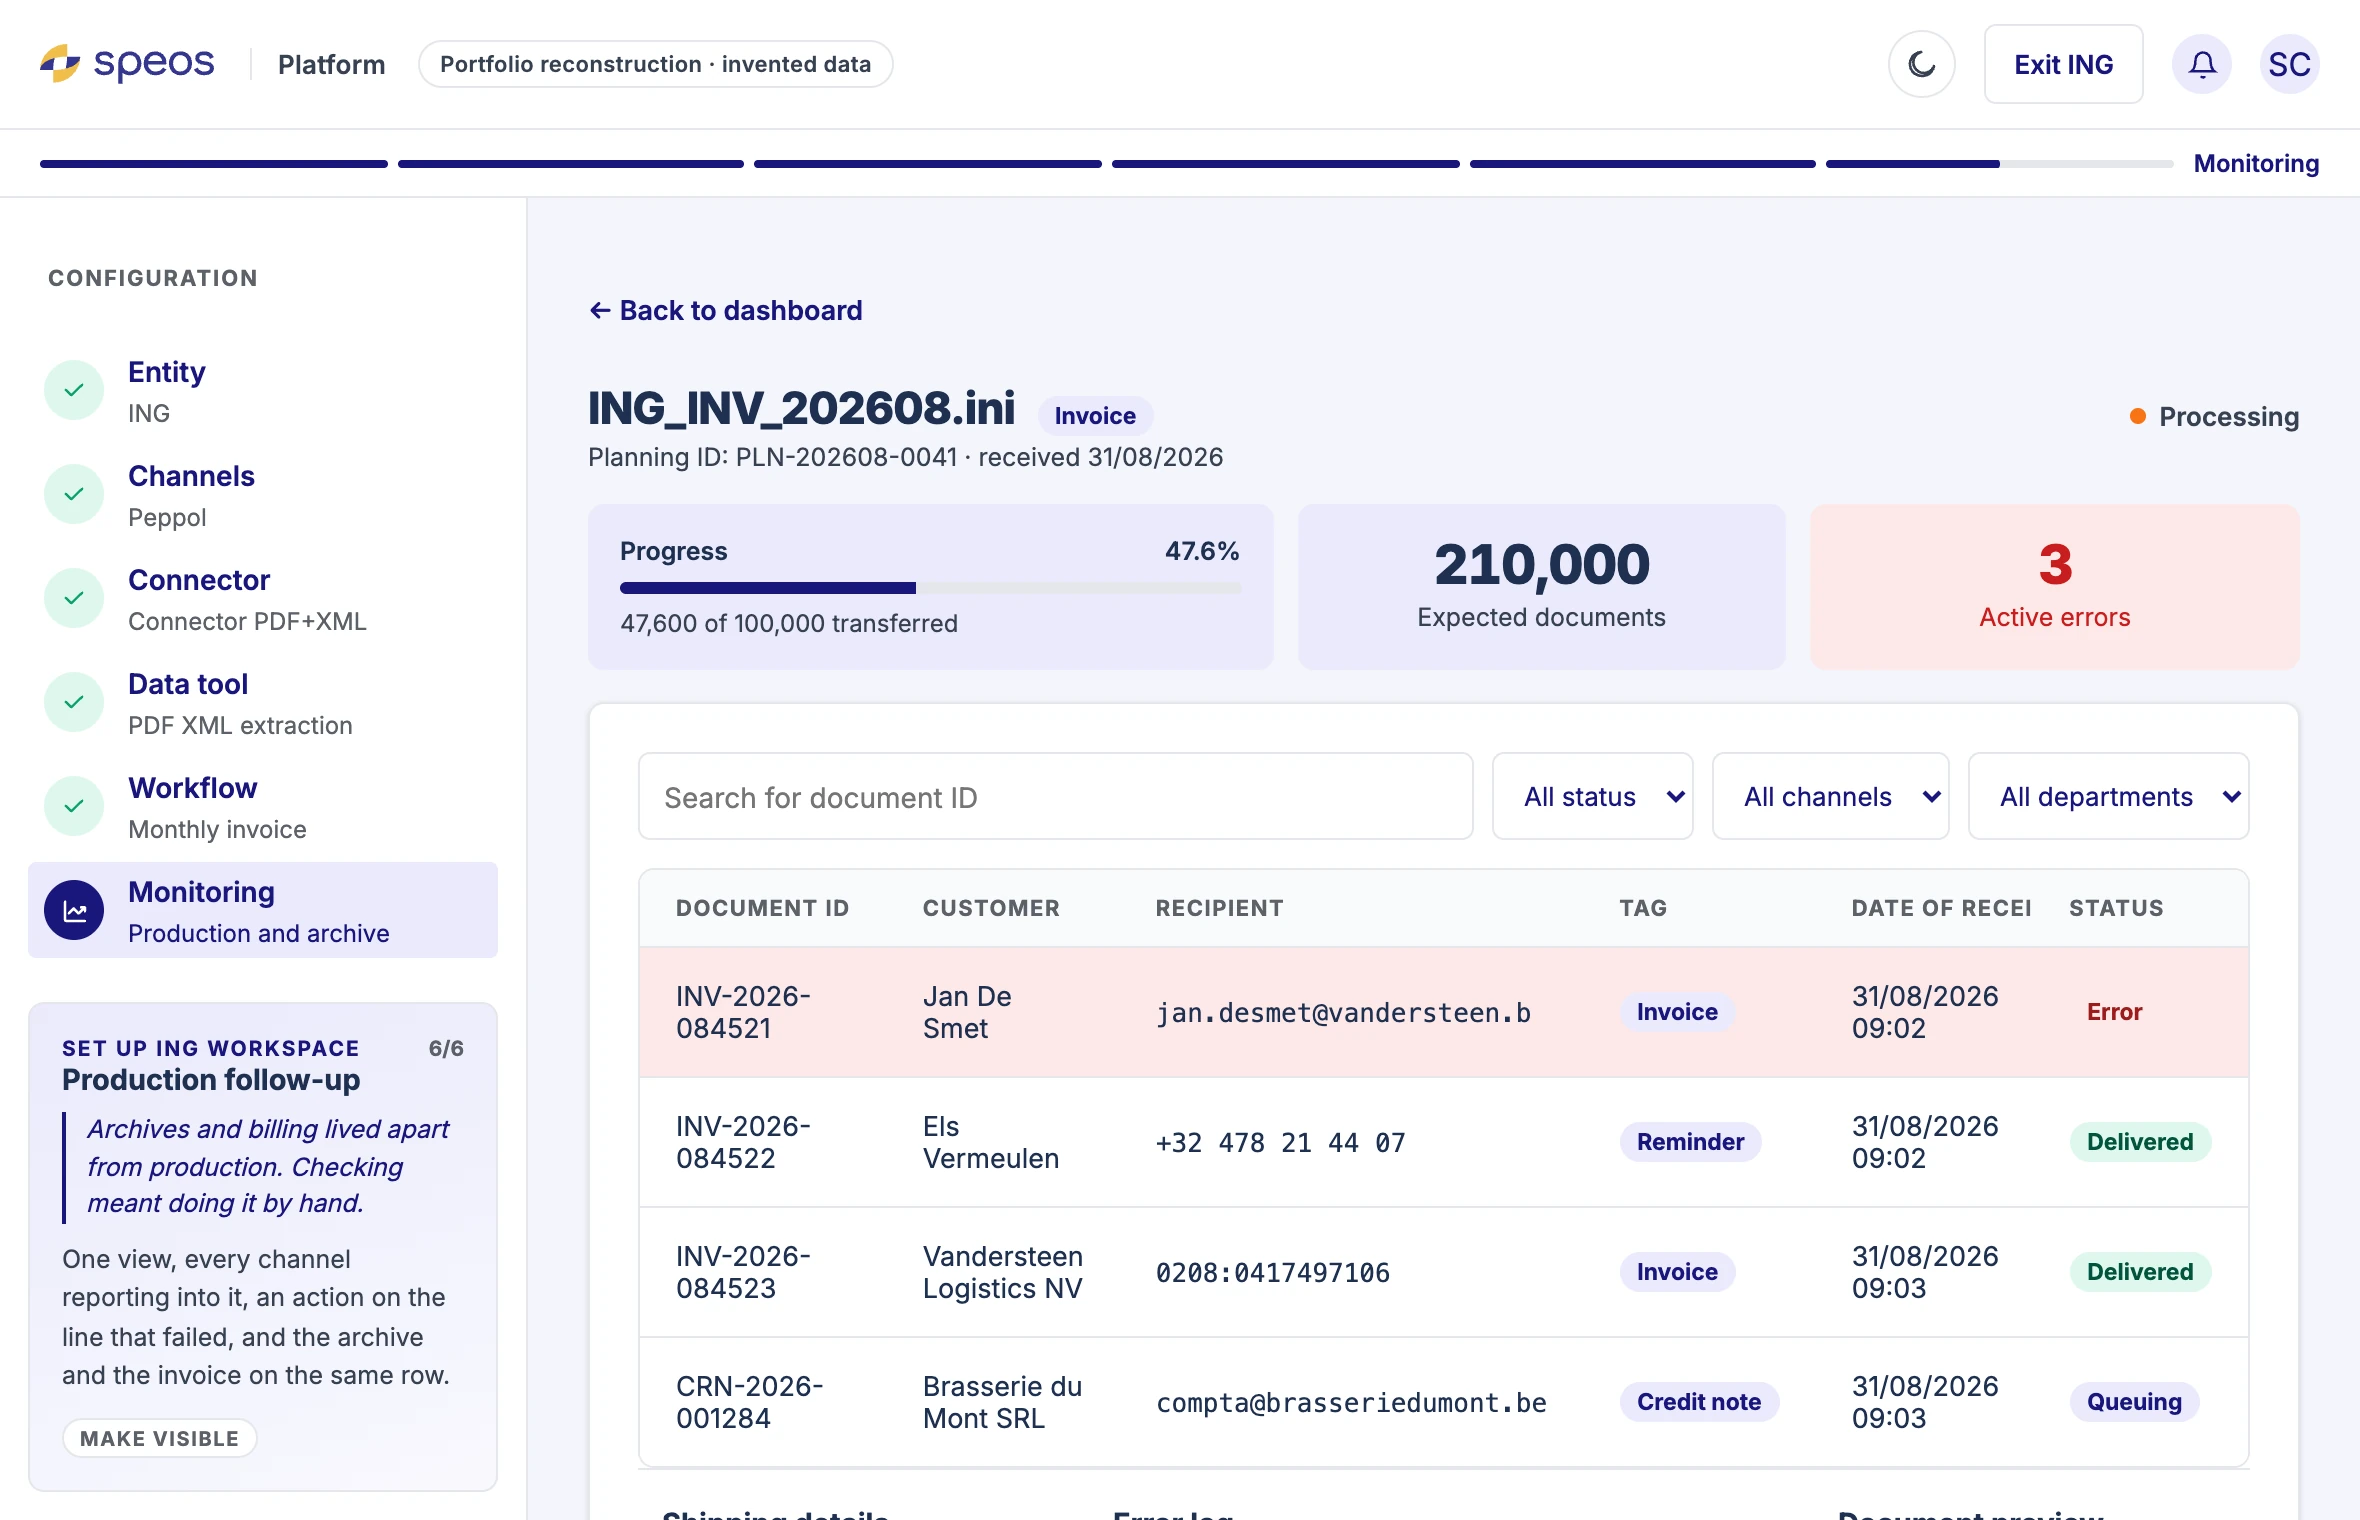
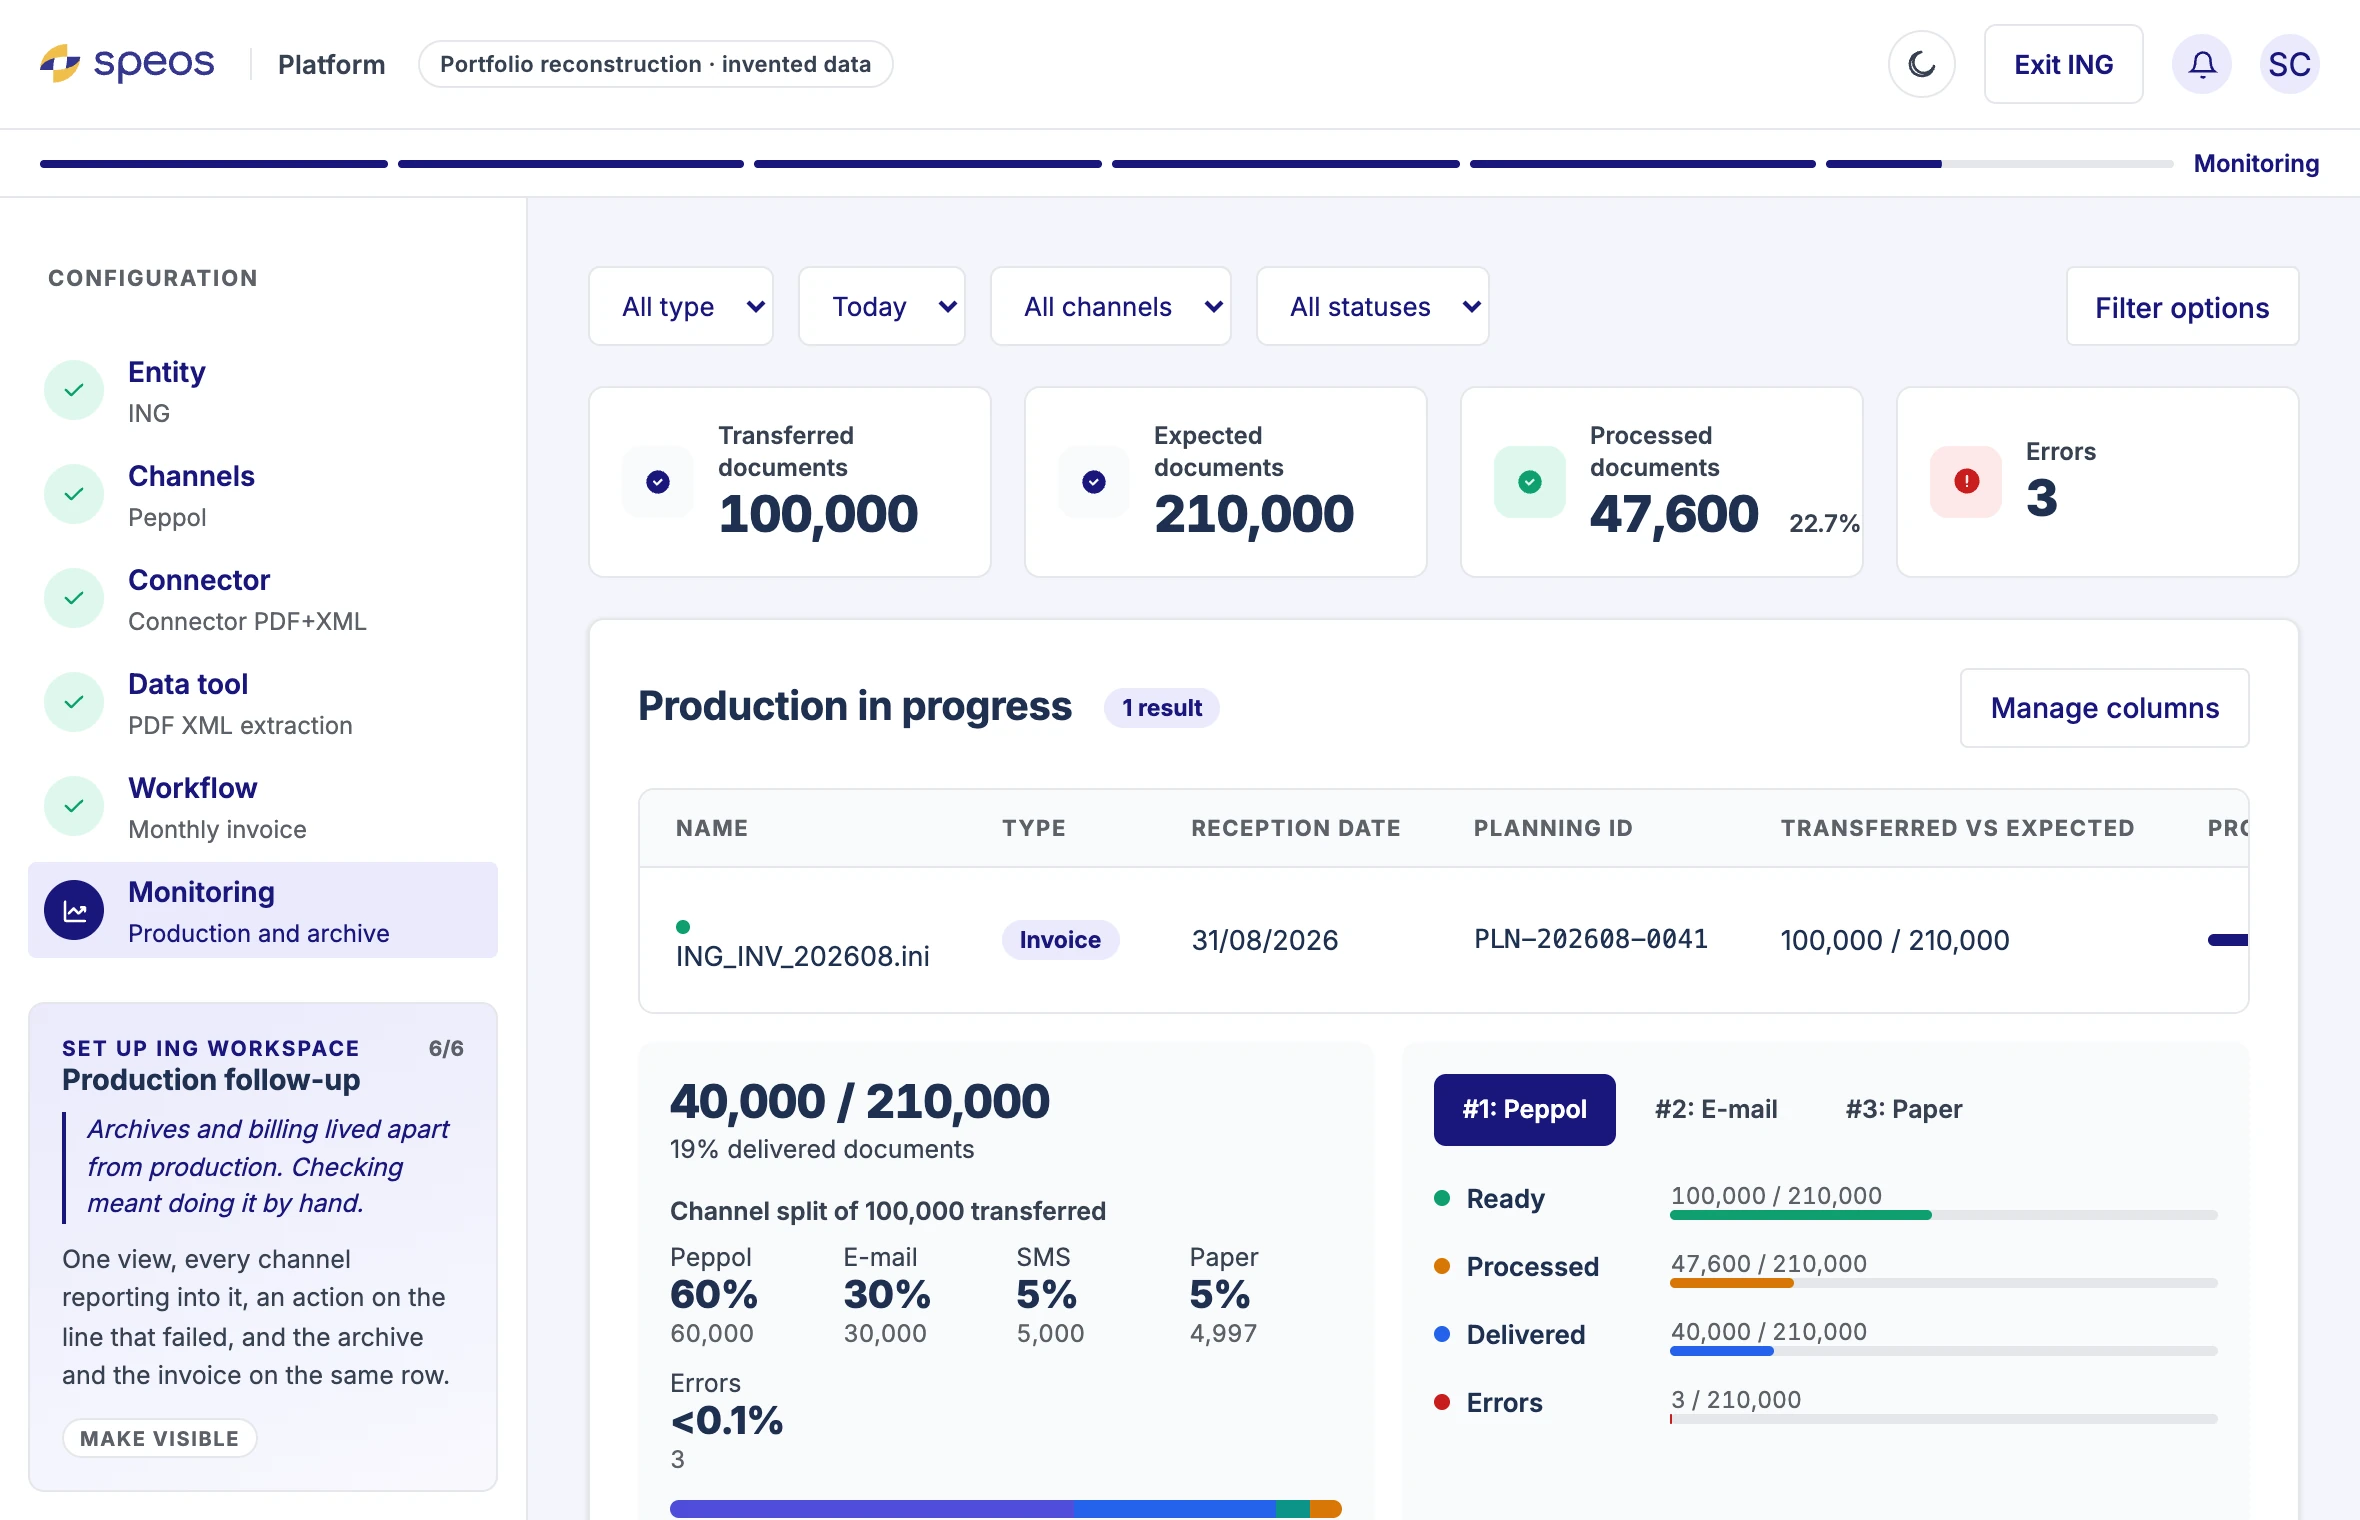
Monitoring: see errors before they become incidents.

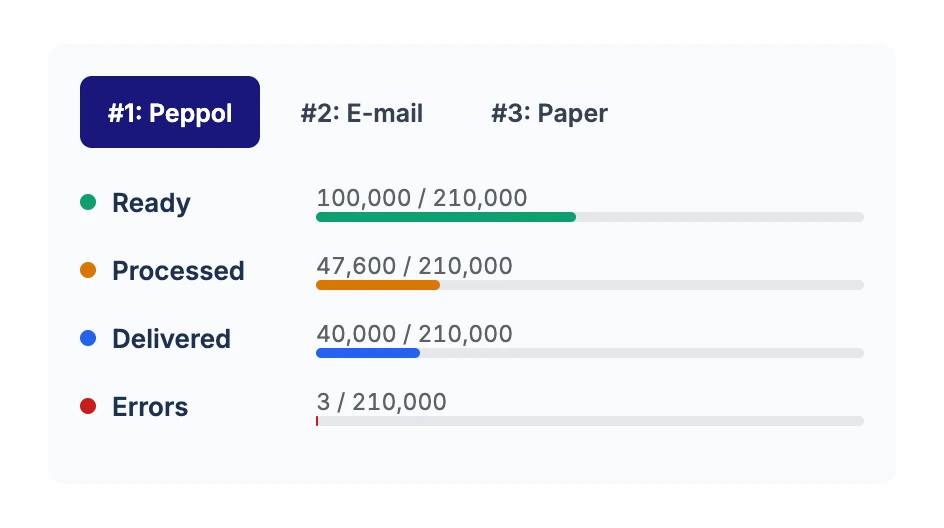
  • Processing status, from batch to document.
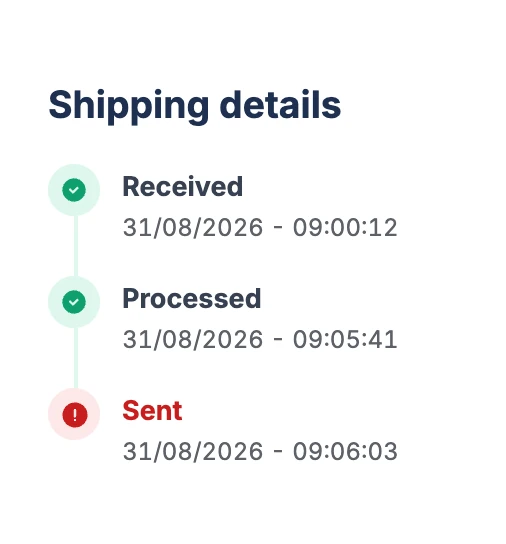
  • Alerts that distinguish errors, expected actions and confirmations.
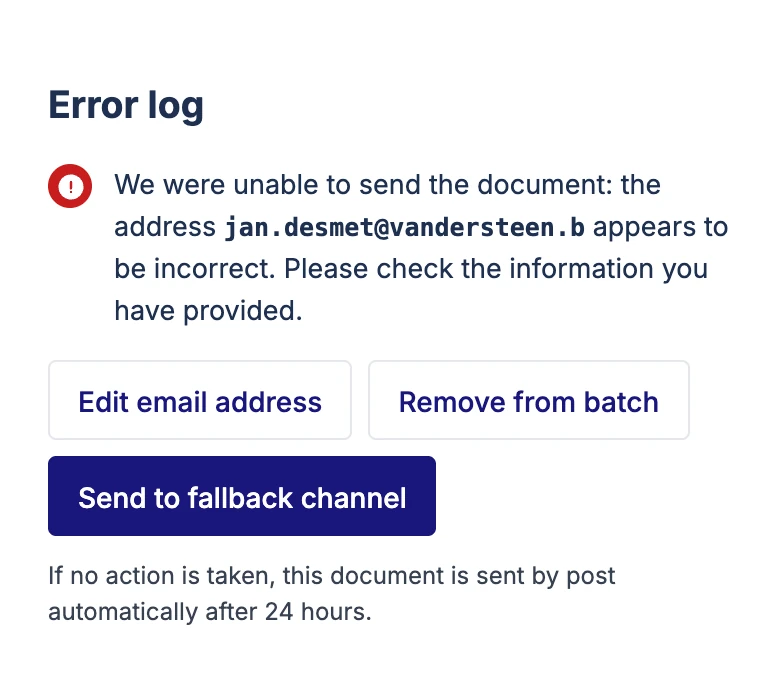
  • A failed document is reprocessed without resending the batch.
  • History and evidence stay available for audit.
"Moustafa is not looking for a 'cool' product, but an ultra-reliable cockpit to steer his documents."

Excerpt from the Moustafa Ochao persona, print and archiving expert, nearly forty years in the trade with the same client.

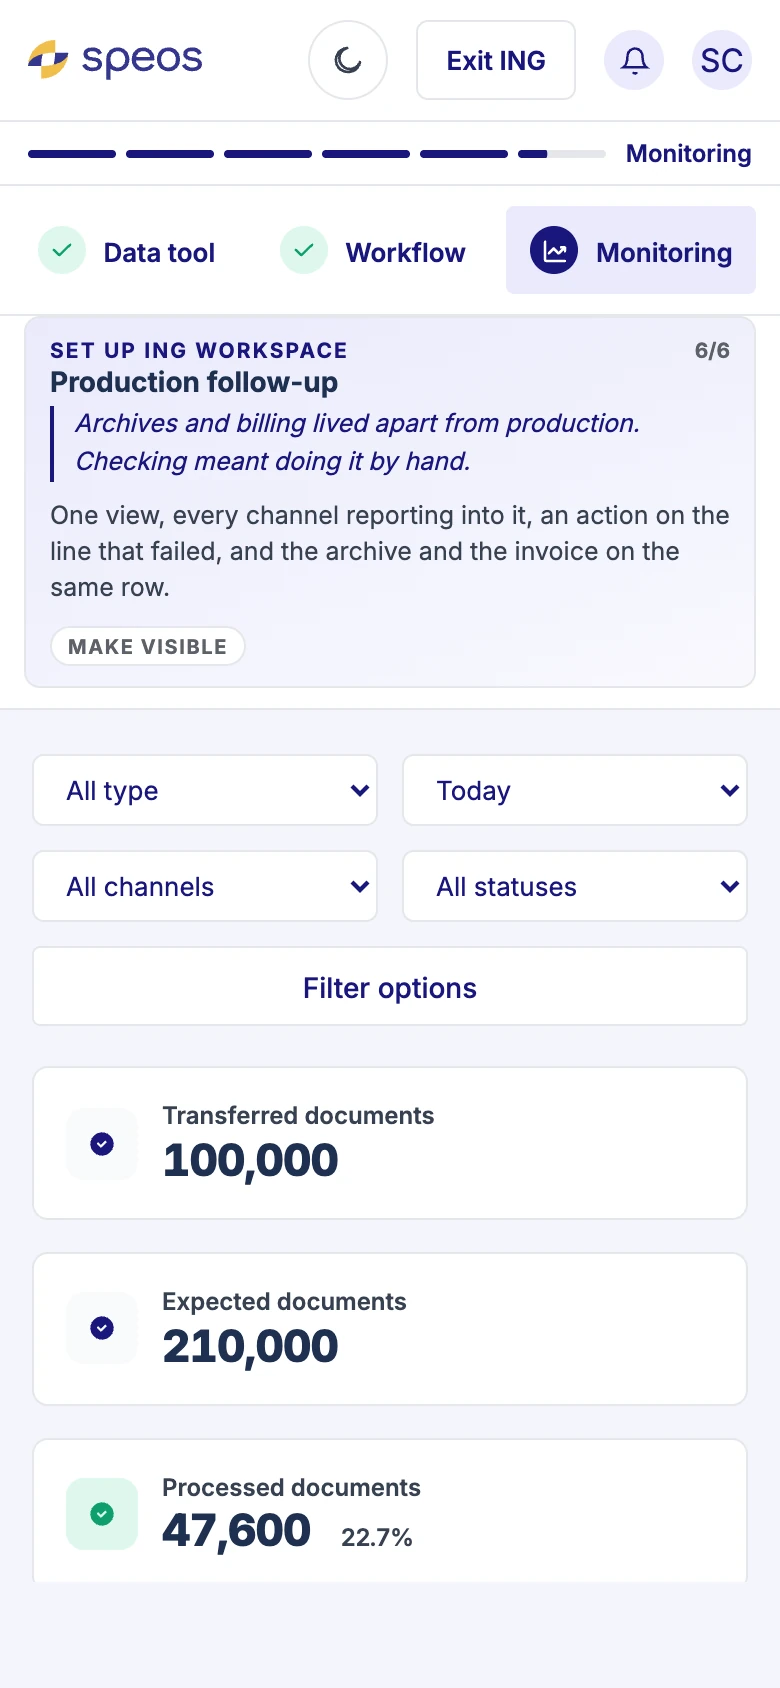
Monitoring, from the waiting page to the alerts, screen by screen. Prototype of the target vision, demo data. Move between screens with the arrows.
See the platform's other capabilities: reporting, billing, support, governance
The same foundation carries reporting, billing, support and governance, screen by screen. Prototype of the target vision, demo data. Move between screens with the arrows.
06

Clients validated the direction, not every detail

The tests confirmed the value of the concept and revealed what needed rework.

  • Six pilot clients out of six validated the direction.
  • At Engie, two users evaluated three scenarios: dashboard, error handling, audit trail.
  • The dashboard scored best: 4.4 out of 5 on average.
  • Audit trail reassurance dropped to 1 out of 5 for one user: sent back to design.
  • The test fed the backlog before development: search by file, stop a batch, reprocess a single document.
4,03 / 5combined score across the three scenarios
9 / 10average recommendation score, given by both users on every scenario
2 × 3two users, three scenarios: a qualitative test
1 / 5audit trail reassurance for one of the two users: sent back to design
The scores come from a qualitative test with two Engie users; they indicate a direction of validation, not a large-scale statistical measure.
07

The project had to continue after the mission

The deliverable was not just a platform: it was a shared way of designing and running projects.

  • Junior designers coached: research, journeys, information hierarchy, design system.
  • Developers supported: Figma components translated into reusable Tailwind components.
  • Project managers supported: framing, workshops, prioritisation, field validation, Agile roadmaps.
  • 76-page Concept Report signed by the sponsor.
  • The validated scope moved into production.
Junior designersResearch, journeys, information hierarchy, design system consistency
DevelopersFigma components, shared rules, reusable implementation
Project managersFraming, workshops, prioritisation, field validation, Agile roadmaps
Three levels of coaching to keep the approach alive: design consistently, implement with shared components and integrate user experience into how projects are steered. Synthesis diagram.
Browse the Concept Report, 76 pages
Page of the SPEOS Concept Report. Use the reader controls to browse the document.
1 / 76
The complete 76-page Concept Report, readable page by page and chapter by chapter: this document, segments, journeys, value propositions and prioritised roadmap, is what the sponsor validated.

A similar challenge on your side?

For an engagement or an interview, write to me.

hello@christophevanengelen.com View my LinkedIn profile

I reply within 24 business hours.