Untapped payment data, turned into a B2B service.

BNP Paribas Fortis wanted to turn its payment data into a service for retailers. I designed and tested that service in the field: a pilot client committed before the first line of code.

Read the essentials

The essentials in 40 seconds

BNP Paribas Fortis · Banking · 2018–2019

Turning unused payment data into a service that merchants want to buy.

BNP Paribas Fortis holds about 30% of the retail banking market in Belgium: its anonymised payment data describes the country's commerce like no other source, yet no service existed for retailers. Over 12 months, I designed the service that makes this data useful and tested it with them. A pilot retailer committed to buy before the first line of code.

The problem

About 30% of Belgian consumers are clients of the bank: their card payments describe the country's commerce like no other source, but that data slept on the servers. Retailers lacked objective data about their customers and competitors. 4 internal teams (business, IT, legal, marketing) disagreed on the service to build.

My role

Freelance service designer, mandated directly by the sponsor. Frame the offer, test it with real merchants, align the four teams and defend the recommendation up to the investment committee.

What I did

  • Interviewed 6 retailers at their workplace, benchmarked the market (one bank in the world offered this service) and selected a single target: multi-shop retailers without a data team.
  • Ran the workshop that set the scope: 18 candidate objectives grouped into 4 analysis goals, instead of free data exploration.
  • Designed the complete concept, from dashboard to access journeys, and tested the mockup with the 6 pilot retailers.

The result

  • Léonidas committed as a pilot client before development.
  • The 4 teams validated the same scope.
  • The sponsor secured investment approval, with a backlog ready.

Recommendation

“One of his greatest strengths is his ability to turn data opportunities into compelling value propositions, a skill that was widely recognized and appreciated by everyone around him. […] Above all, I've always been impressed by his professionalism and his commitment to every project he takes on.”

The Léonidas shop, one of the six pilot merchants of the project.
Léonidas committed as pilot client before development.
01

Research sizes the market and keeps a single target: multi-shop retailers without a data team

The service to invent: turning payment terminal transactions and the bank's anonymised client profiles into a tool for retailers, without creating any new data. The input material existed: 9 B2B personas and an internal study. Research first sized reality: the market exists, but usage of the bank's digital tools remains low; the solution would have to be simpler than what exists.

Segmentation eliminated two entire segments as not interested: multi-shop retailers already equipped with data support, and B2B businesses. Single shops remain a secondary target. The chosen target: multi-shop retailers without a data team. The benchmark confirmed the space: one bank in the world offered this service, BBVA in Spain, with a catalogue of 120 metrics; the other reference, Proximus's data intelligence offer, sells a visualisation. Neither sells decision support.

An available data assetPayment data not yet turned into a commercial service
A validated value propositionOne target, one buying driver, six barriers and a deliberately limited MVP
Commercial proofLéonidas commits as pilot client before development
The project reduced risk before the technical investment by first validating usefulness, the value proposition and a client's commitment.
SMEs and small businesses
Chosen target Multi-store merchants A brand or marketing manager runs several points of sale, with no in-house data team.
Single-store owners The owner runs the point of sale alone. Outside the scope of the first version.
Segmentation of the professional market: the most promising segment for testing the service's traction. Recreated from the 2017 artefact.
1 500potential corporate clients
901present in Easy Banking Business
234active users of the tool
15 %regular usage only
The pilot sizing, as documented in the Concept Report: the market exists, usage of digital tools remains to be built.
02

The interviews set 1 driver against 6 barriers, among retailers who have never worked with statistics

User research with SMEs delivered a clear balance of forces: a single driver, easy access to massive data no other player holds, against 6 barriers phrased in the retailers' own words. Those 6 barriers became the criteria for deciding what to build, and what to leave aside.

The decisive insight lies elsewhere: these retailers have never worked with statistics and have no marketing knowledge, yet they understand that data can help their business. The barrier is not conviction, it is access. The value proposition wrote itself in response: an easy-to-read dashboard that prompts insight, carried by a bank as a trusted data partner.

Driver

Simple access, through the bank, to large-scale data no other player offers them.

Barrier 1

Actual usefulness: "what do I concretely do with this in my shop?"

Barrier 2

Reliability: only card transactions are counted.

Barrier 3

The comparison: are the selected competitors really the right ones?

Barrier 4

"I get statistics, but no new customers." No one-to-one contact.

Barrier 5

Nothing on product performance, where expectations run highest.

Barrier 6

The return on investment, at the price being considered.

One driver, six barriers, phrased in the merchants' own words. Recreated from the 2017 artefact.

What the merchant is looking for

  • Know their clients and competition better to adapt their offer.
  • Measure the effect of their actions and communication.
Their concerns
  • "I have no data expertise, and no time to build it."
  • "Will my customers accept this use of data?"

The service's answer

  • Reports focused on a precise goal, with a clear action at the end.
  • Aggregated client profile and geolocation, footfall and trends.
  • The bank as a trusted third party for sensitive data.
  • A dashboard readable without a data team.
The Value Proposition Canvas, condensed: aligning the service with the merchant's real goals. Recreated from the 2017 artefact.
03

A technical POC that left the value question open

Marketing had commissioned a Spotfire data discovery POC. It did its job: proving that bank accounts and card transactions on terminals could be extracted and cross-referenced. On a real pilot retail chain of 8 points of sale, it processed 63,477 transaction lines, filtered by card type, and profiled customers by age, gender, language and income.

It was never tested with retailers, and no one was convinced of its value for the user. Research had just shown why: a free exploration tool is unusable for a target that has never worked with statistics. The product would have to guide the analysis. To settle that question, I organised the data analysis workshop.

Three screens of the 'data discovery' POC: extracting and crossing the sources worked, the reading was left entirely to the merchant.
04

The workshop turns 18 candidate objectives into 4 goals that carry the analysis for the user

The data analysis workshop aggregated and categorised the real needs of the chosen segment: 18 candidate objectives on the wall, 10 kept in the MVP scope, grouped into 4 named goals: Performance Analysis, Business Expansion, Evaluating Actions, and Market Research, deferred to phase 2.

The principle behind this choice is written in the Concept Report: retailers come with precise goals, want information fast and effortlessly, and will not explore more data than they can process. So there would be no exploratory metrics system, but goal-oriented reports where every screen delivers learnings and actions.

The workshop wall: posted mockups, pinned business goals, first-version scope framed.
The workshop: features grouped into business goals, the first-version scope decided on the wall.
“A dashboard is not about pushing data to customers by means of graphics and visualisations. It's about telling a story, with the data and insights at hand, that supports customers in their decision-making process.”

The founding principle of the value proposition, as written in the Concept Report. A dashboard does not push data: it tells, with the data at hand, a story that supports the decision.

18candidate objectives put on the wall by the 4 teams
10kept in the MVP scope
4analysis goals, with Market Research deferred to phase 2
From brainstorm to scope: the workshop's decision in three numbers.
Concept Report page comparing the two approaches: data exploration struck through, goal-oriented report chosen.
The principle recorded in the Concept Report: data exploration set aside, the goal-oriented report chosen.
05

The MVP scope also states what the product will not do

The MVP targets a Triple Win written in black and white: value for the bank, for the retailer and for the cardholder. Its constraints are deliberate: data available for only a few hundred clients, access solely via Easy Banking Business where security and roles are already solved, daily refresh, and the interactive dashboard as the only channel, with no raw data export and no advisory layer.

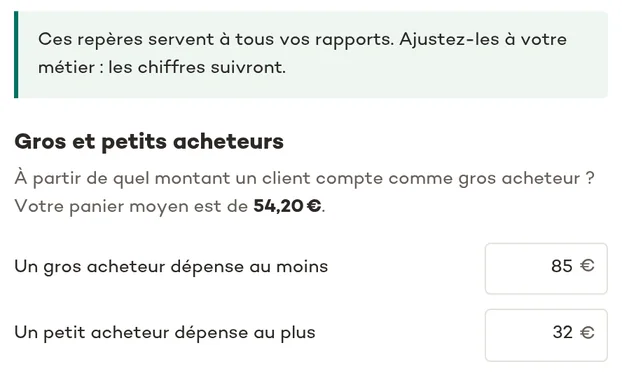
4 client requests were explicitly refused from the MVP by the Lean Team, and documented as such. What the product does not hard-code, the settings absorb: high and low buyer thresholds, the definition of a lost customer, age brackets, and up to 6 configurable comparison sectors, the real answer to the barrier about competitor relevance.

Kept · dashboards per goalGoal-oriented reports, online, interactive, refreshed daily.
Kept · the existing channelAccess through Easy Banking Business: security, roles and distribution already in place.
Kept · contextual helpBuilt-in tips explain the tool and the statistics: the MVP's only advisory.
Refused · custom competitorsRequested by clients, excluded from the MVP: the 6 configurable sectors answer it.
Refused · finer profilingExtra segmentation and finer age brackets, deferred until after the MVP.
Refused · user profilesOnly the contract manager handles settings in the MVP.
The scope in two columns: what the MVP does, and what it refuses to do, even at the clients' request.
06

The MVP's 3 goals follow one loop: control, act, then observe the effect of actions

The product architecture fits in one loop: control the state of the business with Performance Analysis, learn and act with Business Expansion, observe the impact of actions with Evaluating Actions. The third goal requires no new data: it reuses the same data as the first two, in the same order.

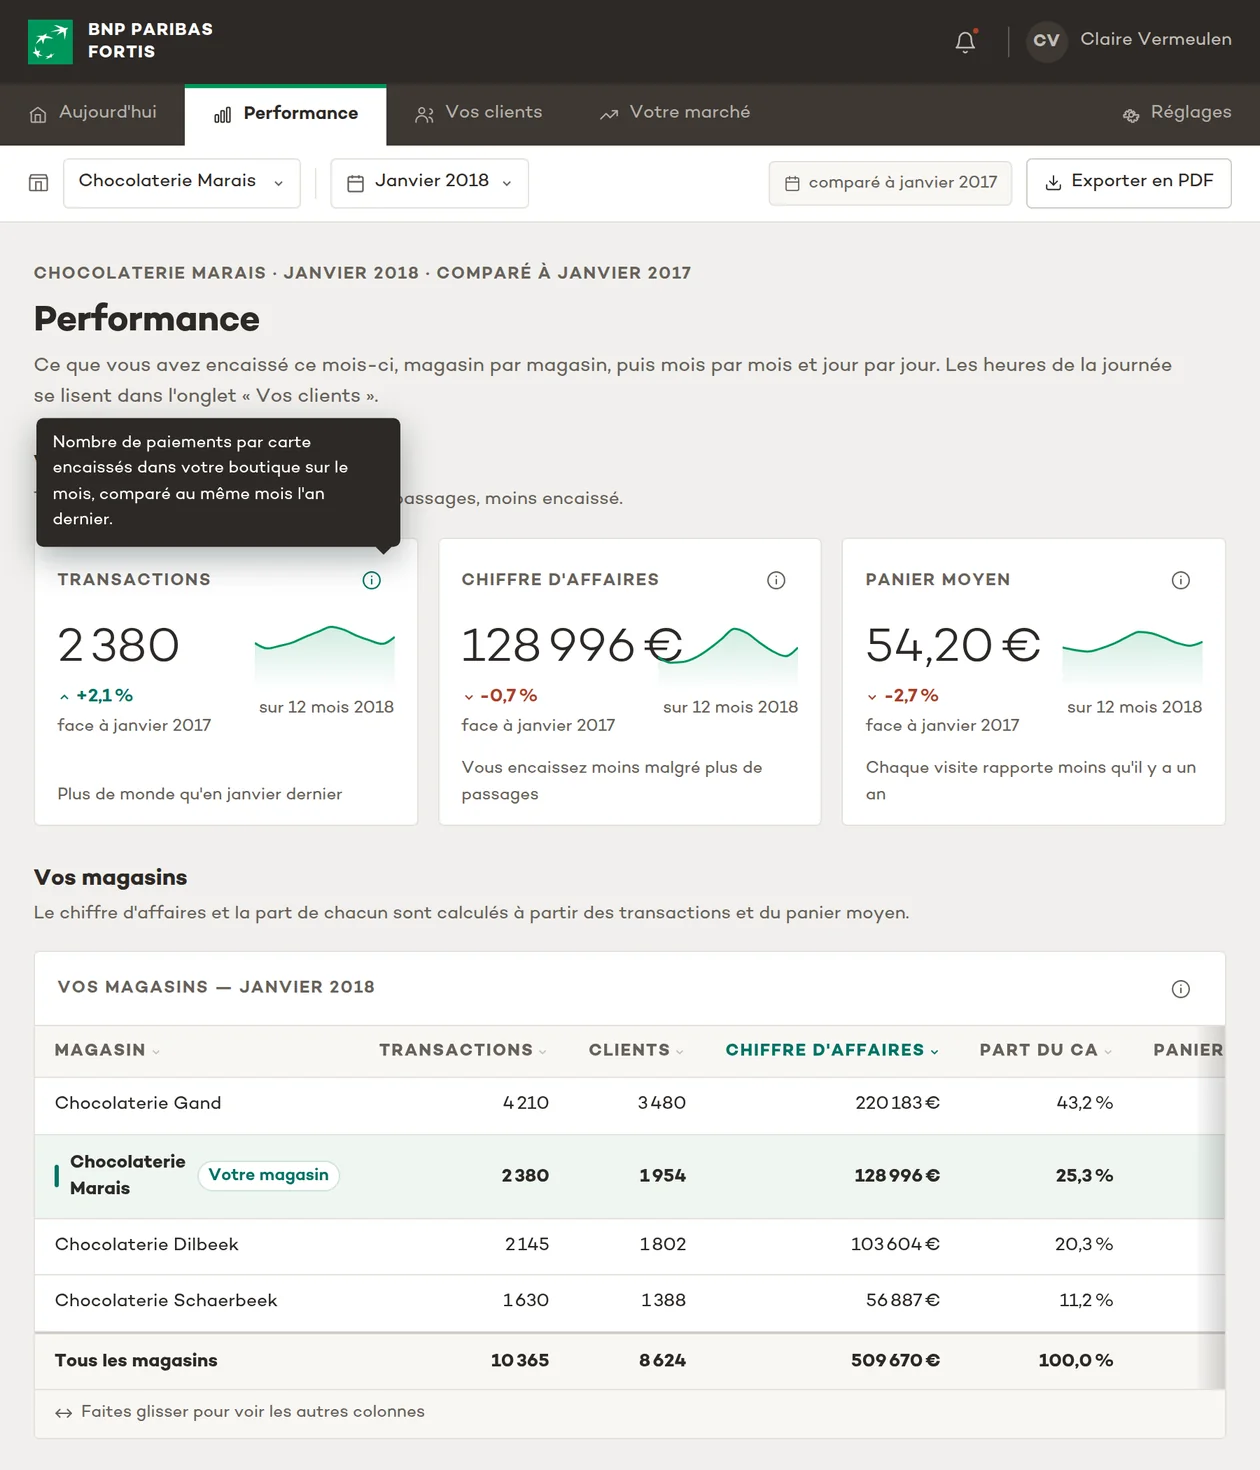
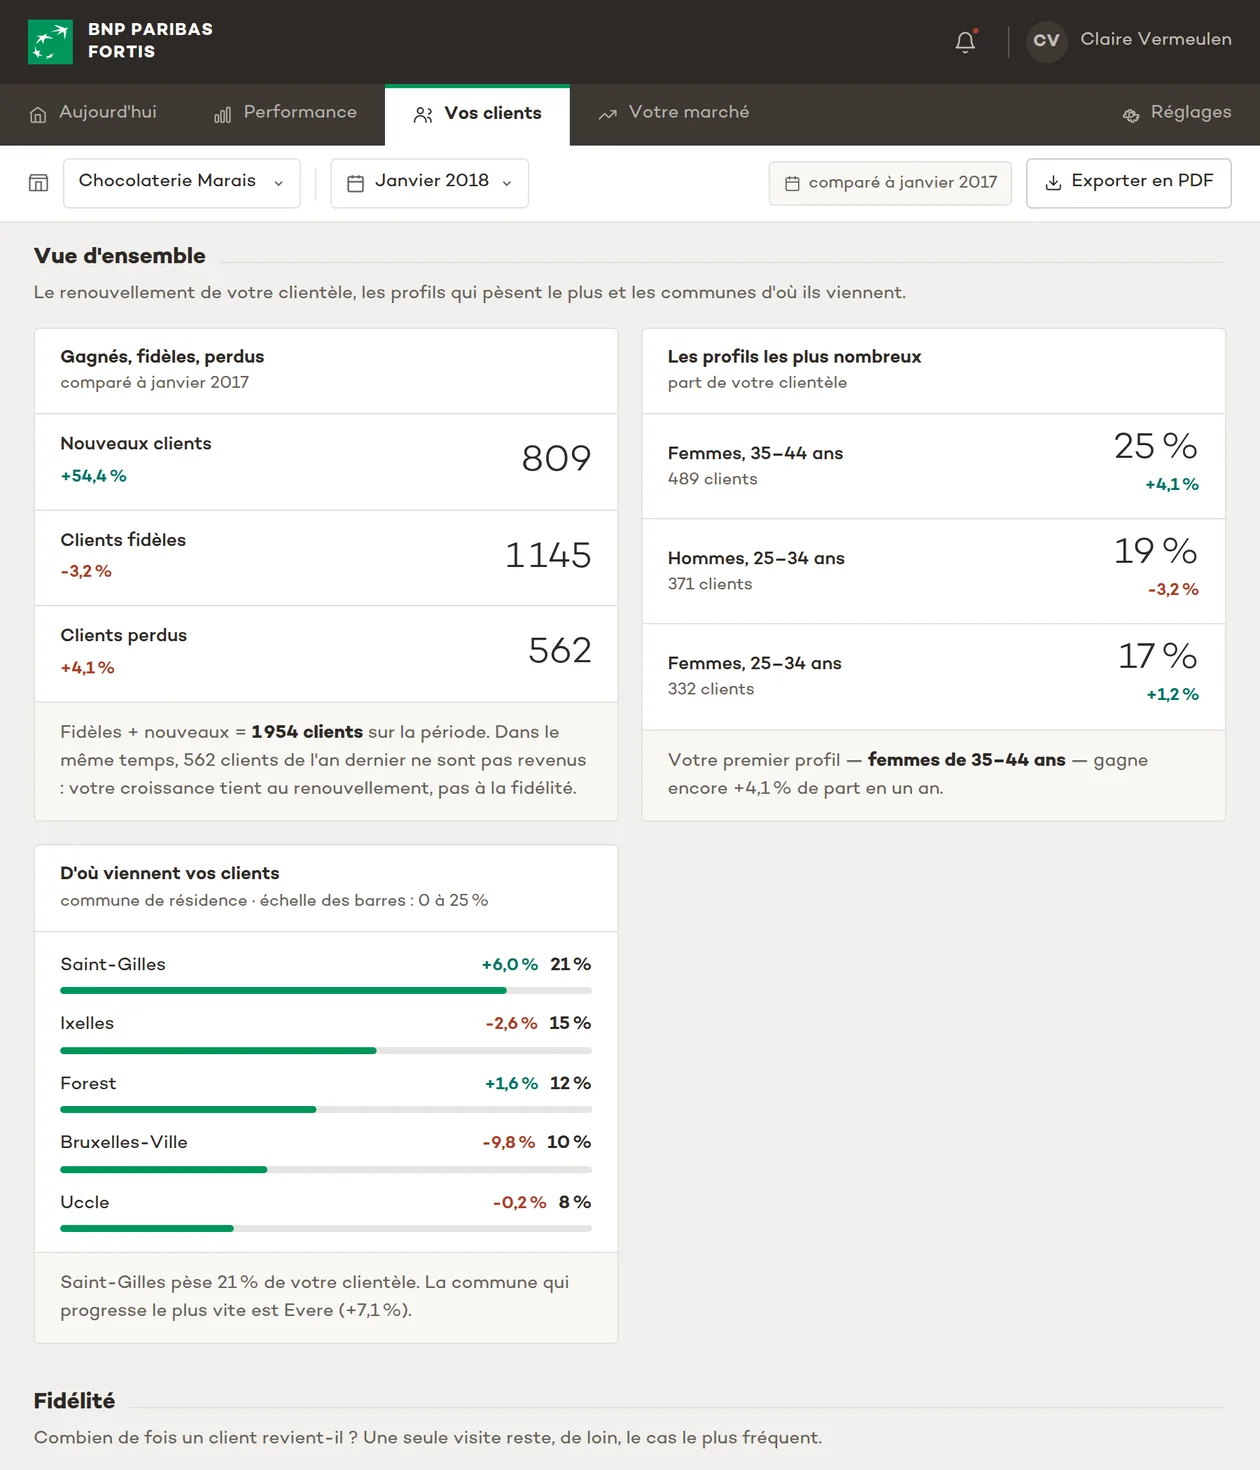
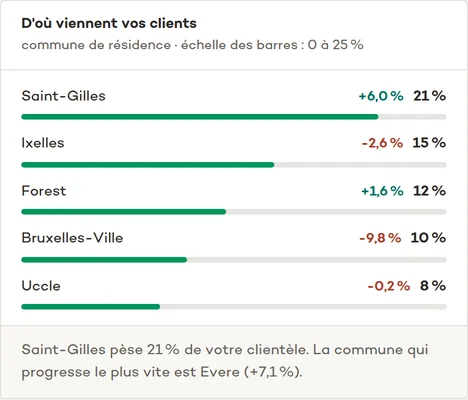
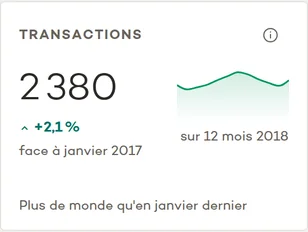
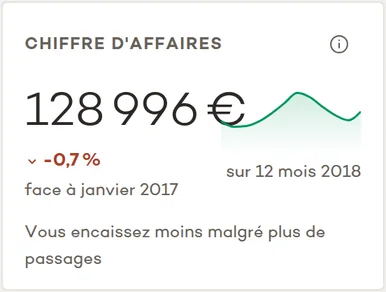
Each goal was mocked up screen by screen on a fictional demonstration business: the home with its 3 indicators, the shop comparison table, customers gained, maintained and lost, retention, and customer origin across Brussels' 12 municipalities.

Control the business stateGoal 1 · Performance Analysis: indicators, shops, evolution
Learn and actGoal 2 · Business Expansion: customers, retention, origin
Observe the effect of actionsGoal 3 · Evaluating Actions: the same data, read as return on action
The Concept Report's product loop: three goals, a single data foundation.
The Goal 1 and Goal 2 screens, mocked up on a demonstration business. Click to enlarge and read the report in detail.
07

Every screen writes the insight in full, down to the choice of comparison periods

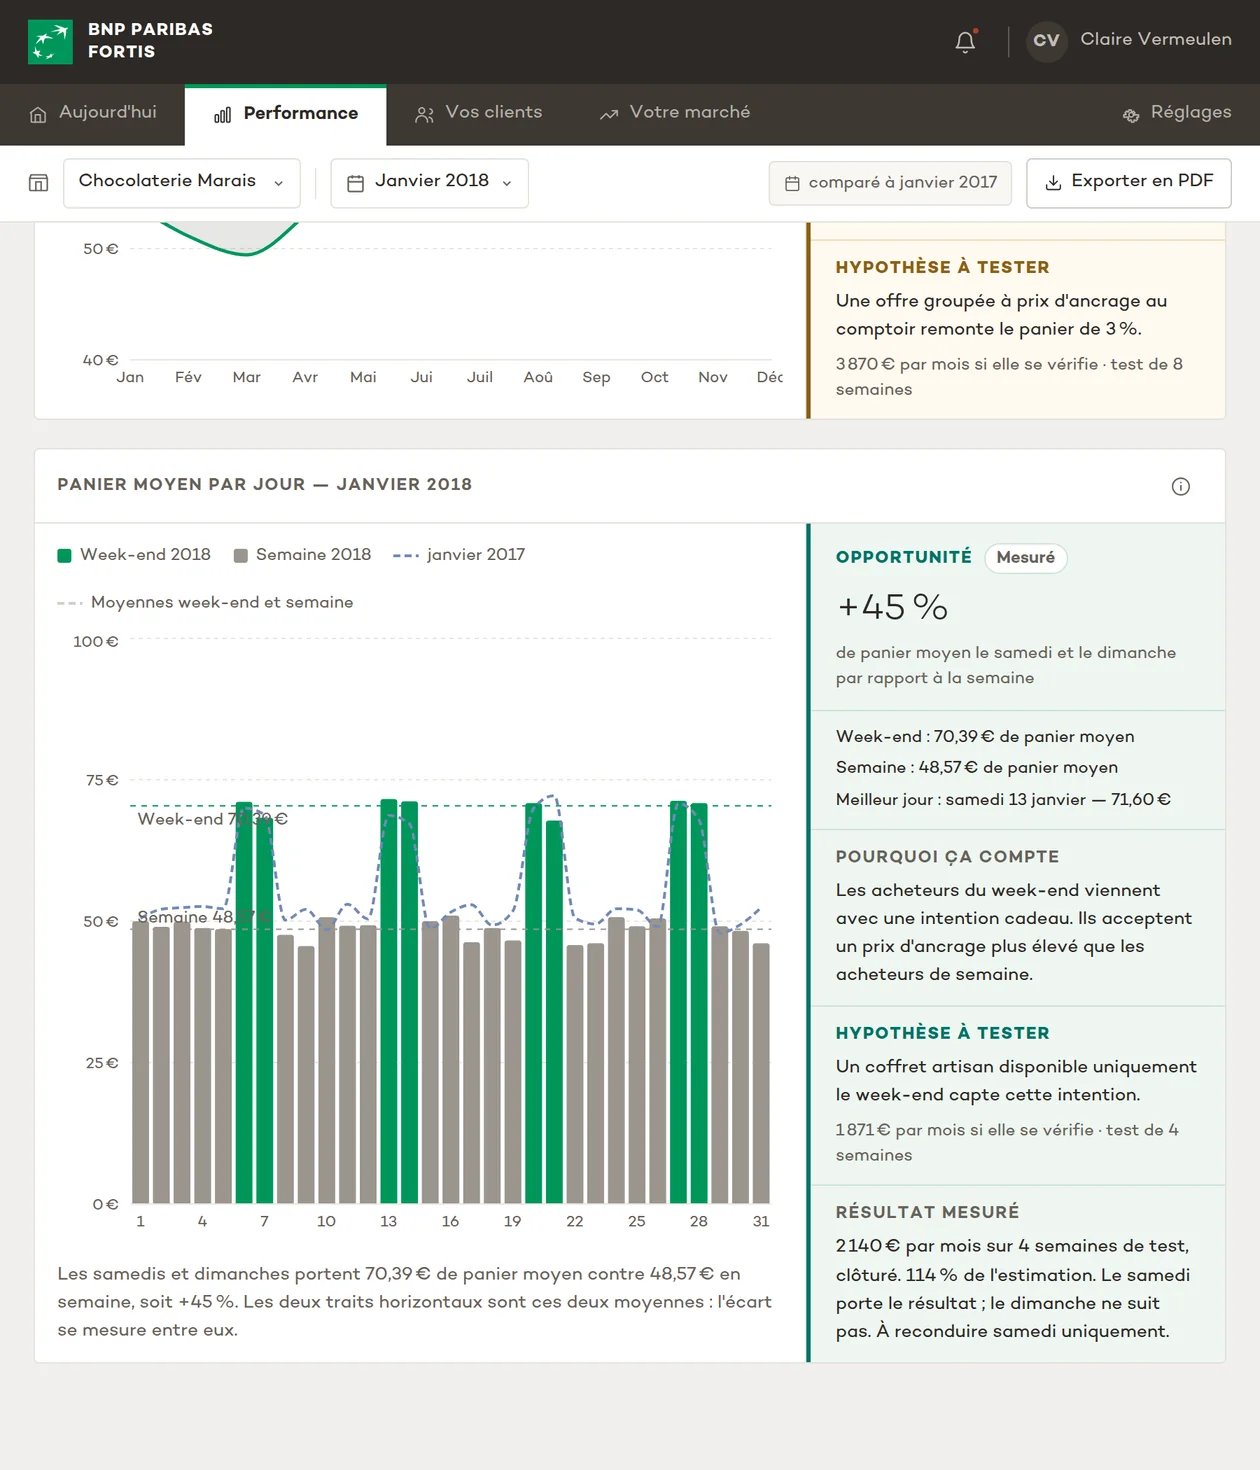
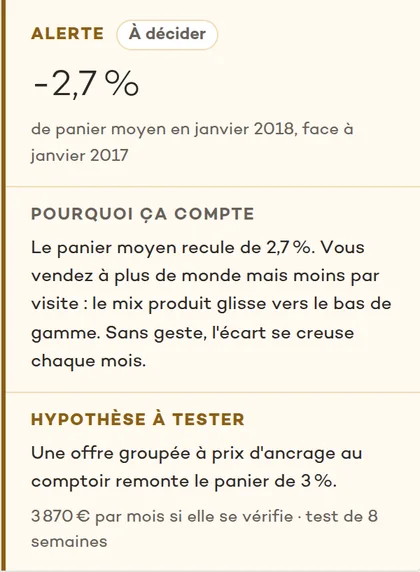
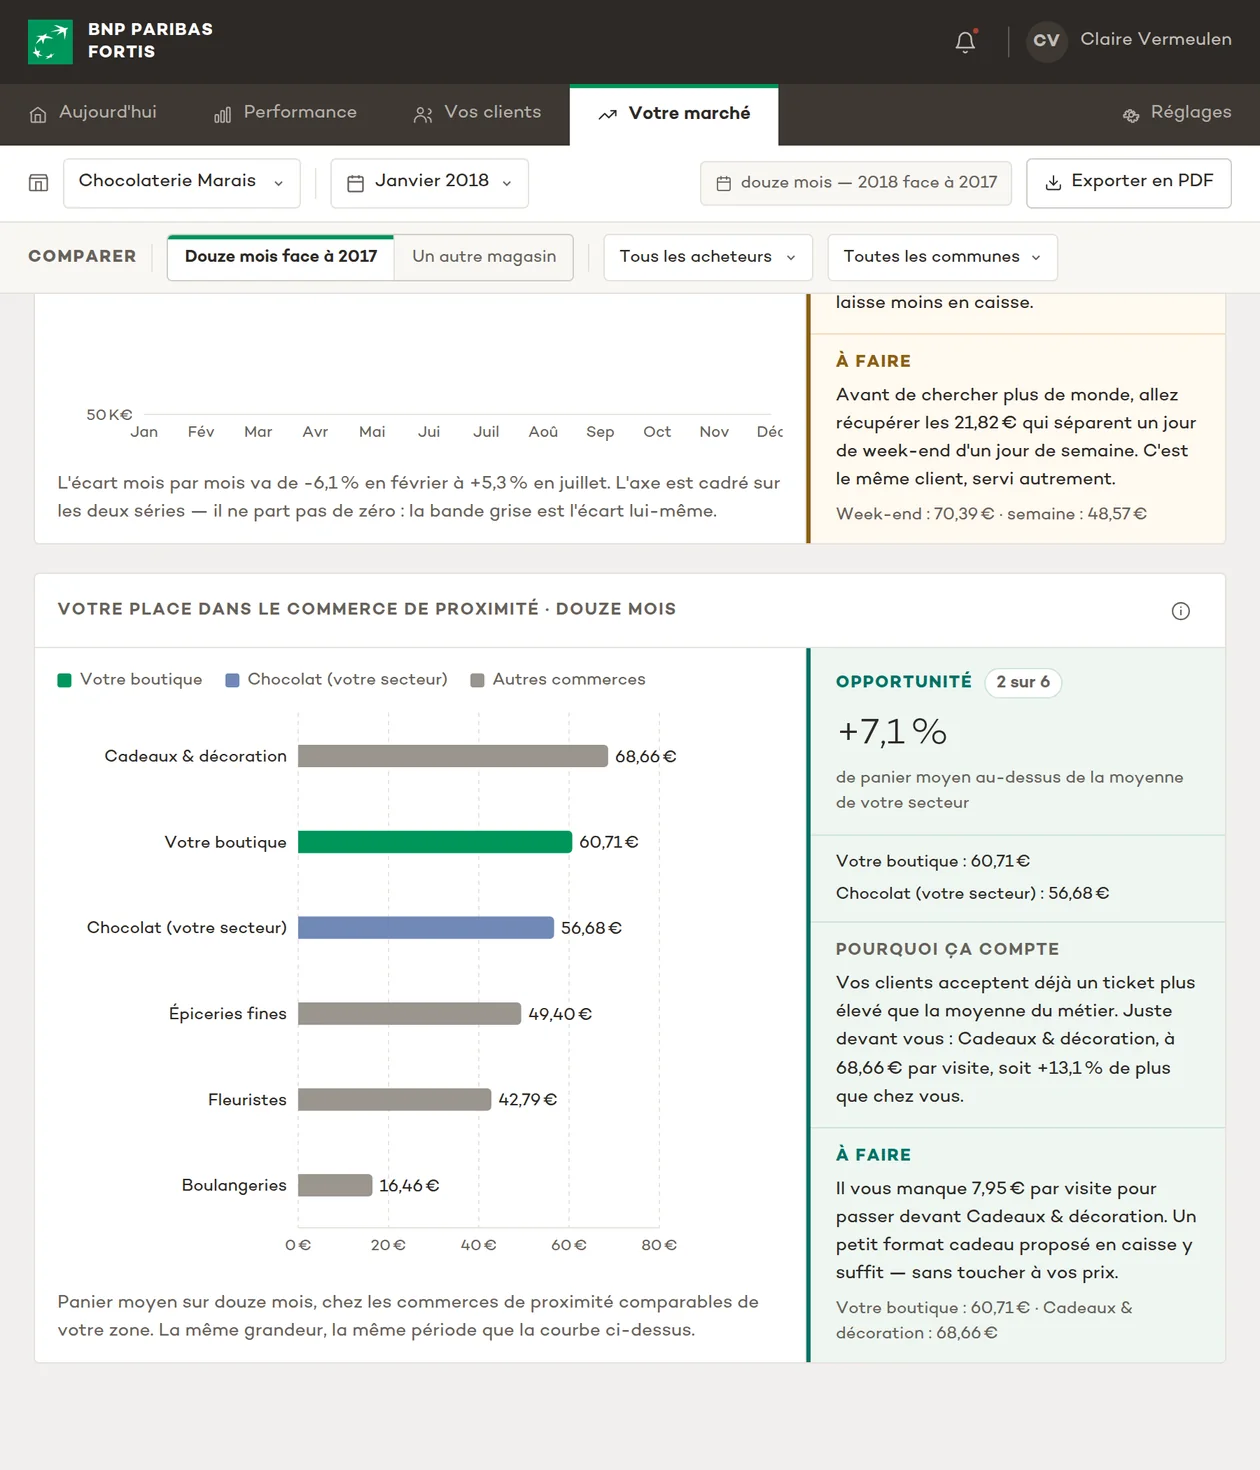
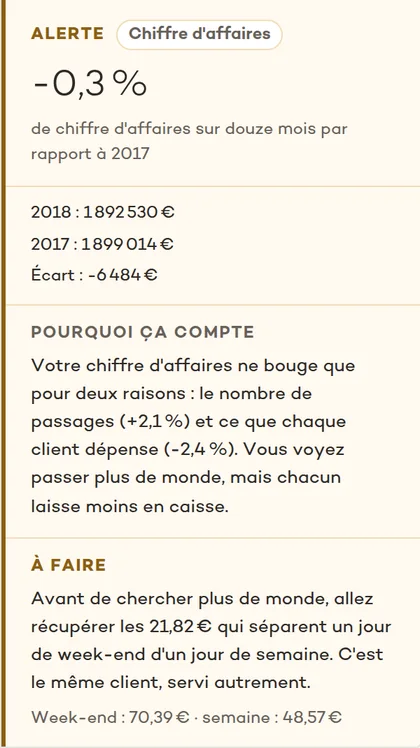
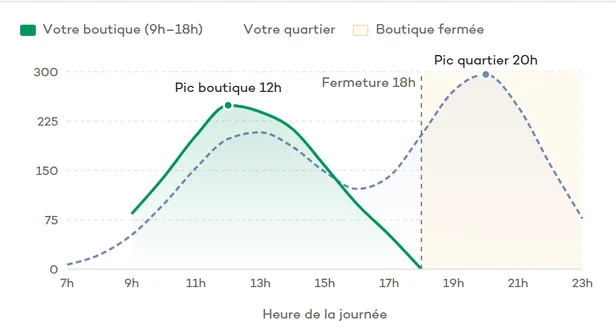
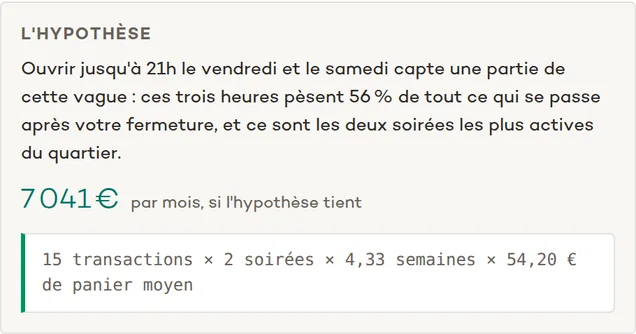
Under every chart, a “What's important” block writes the takeaway for the user, in a shopkeeper's language: “You possibly close 2 hours too early.” The gap between two periods is calculated and written out by default, sparing any mental math; precision lives in the roll-over.

The same discipline applies to time: no free date picker, but 3 canonical comparison bases. And on first use, a 4-step guided tour, optional and refusable, because blocking tutorials kill momentum and get skipped.

Previous periodThe month against the month before
Same period, previous yearThe default reading base of all indicators
Same period, another shopReserved for comparing one's own points of sale
The Time Selection principle: 3 canonical comparisons rather than a free selector.
Goal 3 · Comparison
The annotated comparison screen: +80% revenue, +60% transactions, +35% average basket, every chart with its written insight.
Goal 3's comparison screen: every chart arrives with its written takeaway, the user calculates nothing.
08

Access to the service goes from 15 steps and a branch visit to 2 actions from a link

Service design work also happens off-screen. The existing access journeys were mapped: a non-client retailer went through 15 steps, 1 to 3 days of postal delay and a branch visit for the smart card and identity check. The itsme option was investigated then discarded on evidence: the bank card remained required and the identity check maintained.

The target journeys reuse Easy Banking Business authentication: subscription reserved for the contract manager, terms and contract signed online in a single session, and if someone else tries to sign up, the system notifies the manager by email instead of losing the intent. Deep-link login opens the report in 2 actions.

The same demonstration from two angles: the journey as the user experiences it, then the technical flow. Both make visible the friction of an approach that assumes the prospect is already a bank client. Move between screens with the arrows.
15steps for a non-client, before
1-3 jof postal delay and a branch visit
2actions from a deep link, after
The before and after of the access journey.
The welcome modal: would you like the guided tour, with Not now and Take the tour buttons.
The tour is an invitationRefusable in one click, with “don't show this again”.
First tour step: choosing a report type according to your goal.
Choose your reportOne report per goal, not a menu of metrics.
Fourth tour step: exporting the report as a PDF, with language choice.
Take the report with youPDF export, in the language of your choice: the report travels outside the tool.
First use: a 4-step guided tour, never imposed. Blocking tutorials kill momentum and get skipped.
09

The Concept Report sequences what comes next: 4 deliverables, a phase 2 and quantified milestones through 2020

The 86-page Concept Report handed to the sponsor sequences the work into 4 deliverables: the research, the value proposition, the concept, then the wireframes and access journeys. Phase 2 is already framed: the Market Research goal, whose tab is reserved in the navigation, and user profiles, deferred until after the MVP.

The service serves a quantified business goal: the acquiring offer opened by Corporate Banking in Q2 2018, acquirer status targeted for 2020, and a payment terminal market share raised from 7% to 20%. The investment committee gave its green light, backlog ready, the 4 teams aligned on the same scope.

Page of the BNP Paribas Fortis Concept Report. Use the reader controls to browse the document.
1 / 86
The full Concept Report, 86 pages, readable page by page and chapter by chapter: research, value proposition, concept and access journeys. It is this document that sequenced what came next and secured the investment committee's green light.
ResearchPersonas, interviews, benchmark, sizing
Value Proposition1 driver, 6 barriers, the canvas and the founding principle
Concept4 goals, the MVP scope and its documented refusals
Wireframes & flowsThe screens of the 3 goals, the onboarding and the access journeys
The Concept Report's 4 deliverables, in the order they were produced; phase 2, Market Research, already reserved in the product navigation.

A similar challenge on your side?

For an engagement or an interview, write to me.

hello@christophevanengelen.com View my LinkedIn profile

I reply within 24 business hours.